
milos makes maps
I paint the world with #rstats and teach you how to unleash your inner #map artist. Join my map adventures and tutorials now:
youtube.com/@milos-makes-maps
- Want to learn mapmaking with real-world data even if you’ve never coded before? Here’s the beginner-proof book that takes you from “How do I start?” to “Look what I just built in R.” Let me show you. 👇🏻
-
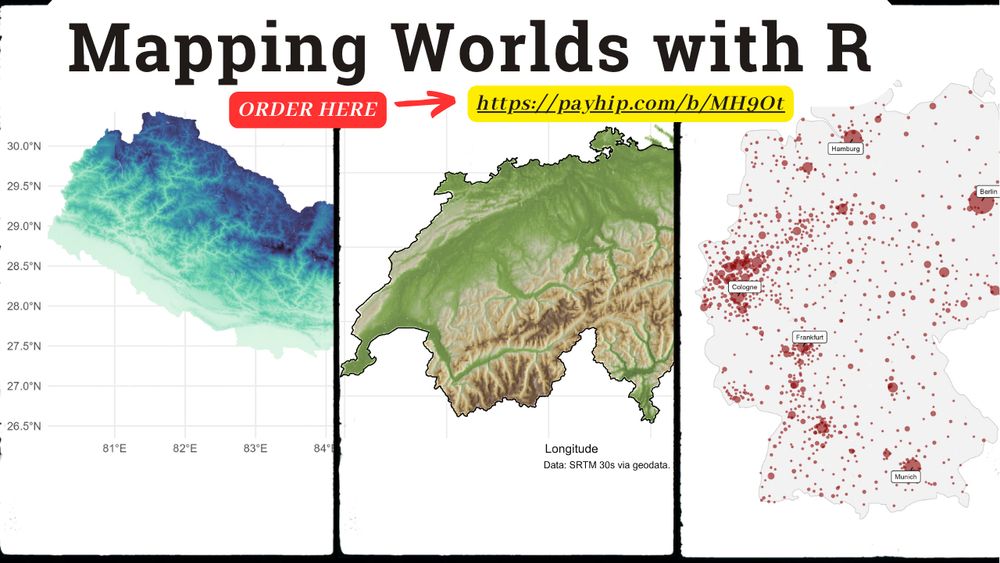
View full threadFormat: PDF + GitHub Pages: 233 (full color) Skill Level: True beginner → confident mapper Price: €19.99 Get it now 👇🏻 payhip.com/b/MH9Ot
- If you’ve ever thought “I wish I could make a map like that…” This book turns that into “I did make a map like that.” Let’s build something remarkable. #RStats #Cartography #DataViz #GIS #MappingWithR #LearnToMap #Geospatial #ThreadsAcademia #OpenData bsky.app/profile/milo...
- The 3 maps you see in the post? Yep, those are just a sample of what you’ll build by the time you finish the book. And you’ll know exactly why every step matters.
- You’ll walk away with: • A plug-and-play portfolio • A repeatable workflow • Clean, modern design skills • Tools for data cleaning, joining & visualization in R • Confidence to map anywhere in the world
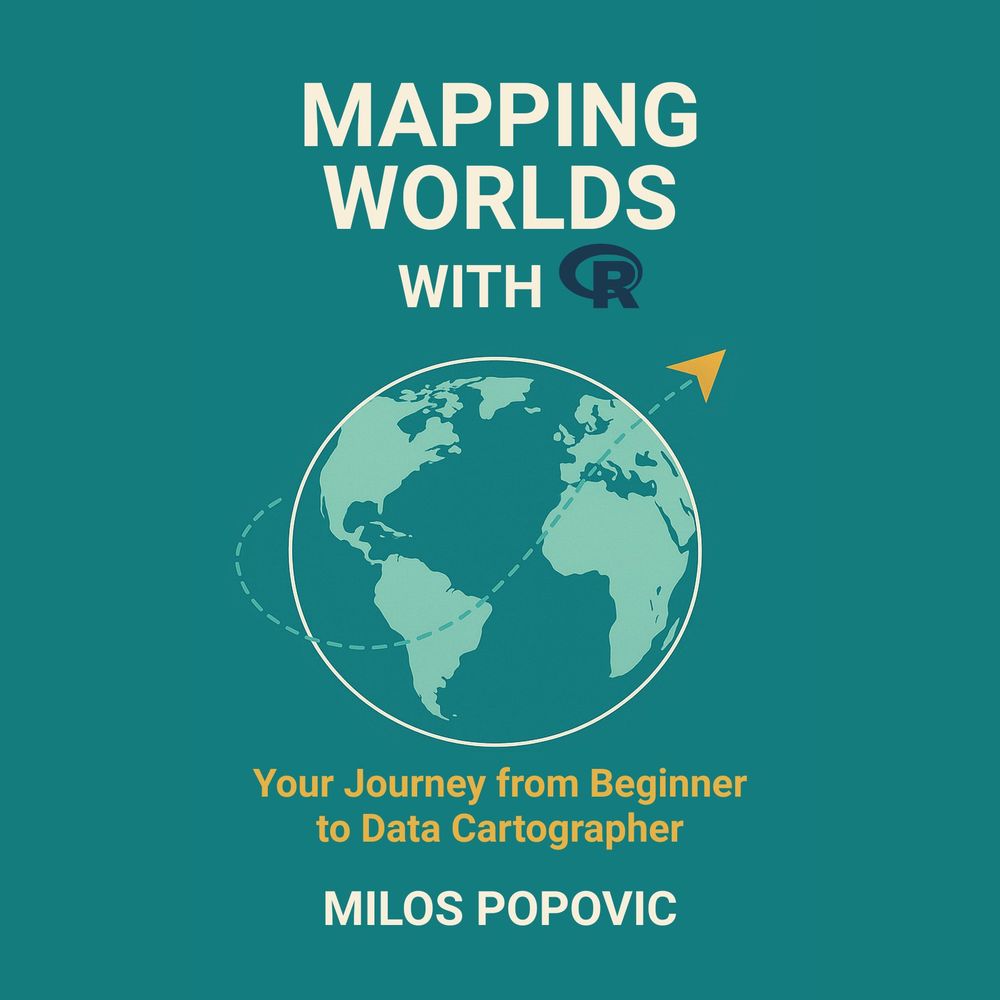
- My new book Mapping Worlds with R is a step-by-step journey from zero to polished mapmaker. Whether you’re a student, researcher, analyst, or curious storyteller, this guide is your shortcut to spatial mastery: no jargon, no guesswork.
- What’s inside? • 11 hands-on projects • Real-world datasets (no dummy CSVs) • Clear, annotated code • Ethical, publication-quality maps • Bonus GitHub repo to clone and remix • Lifetime updates included
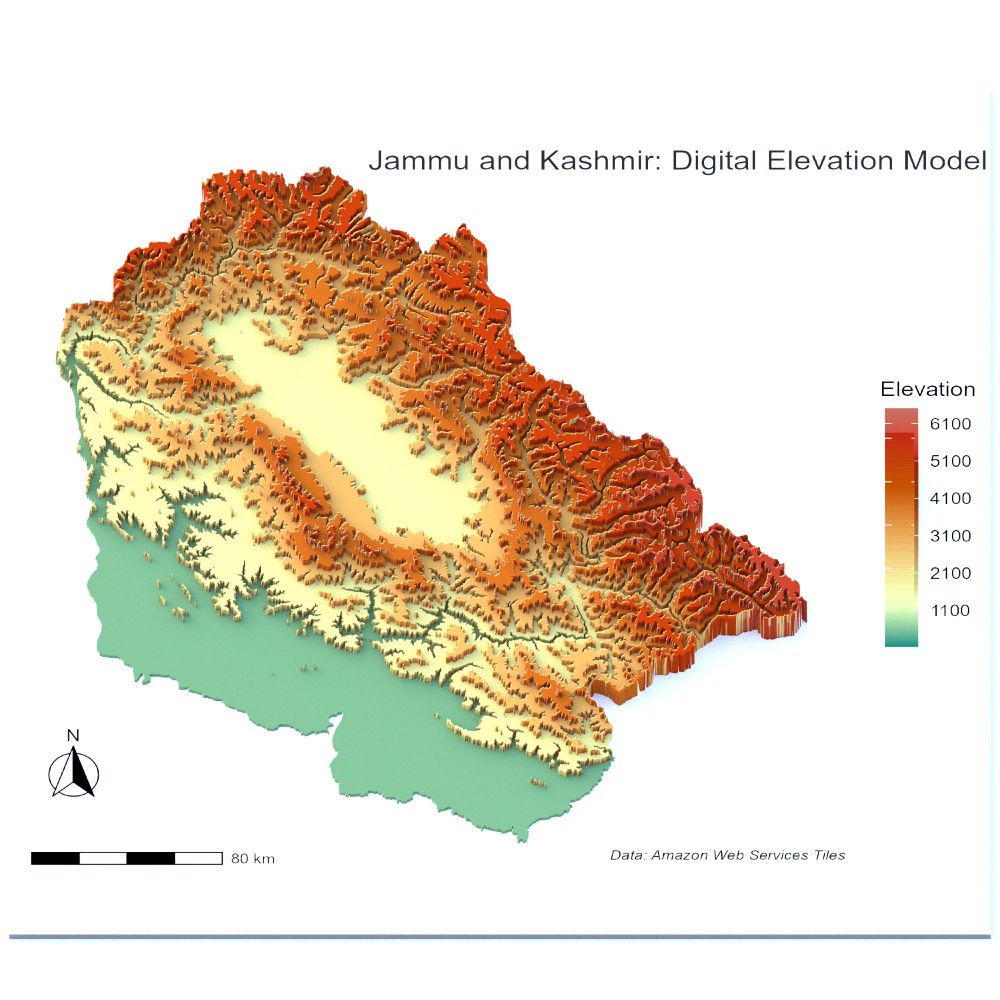
- Lovely map! Thank you for putting my tutorial to good use @sofialazar.bsky.social! Make your Tanaka-style 3D elevation maps in a heartbeat with the help of my new tutorial 👇🏻 youtu.be/q4GIQGRnTNI
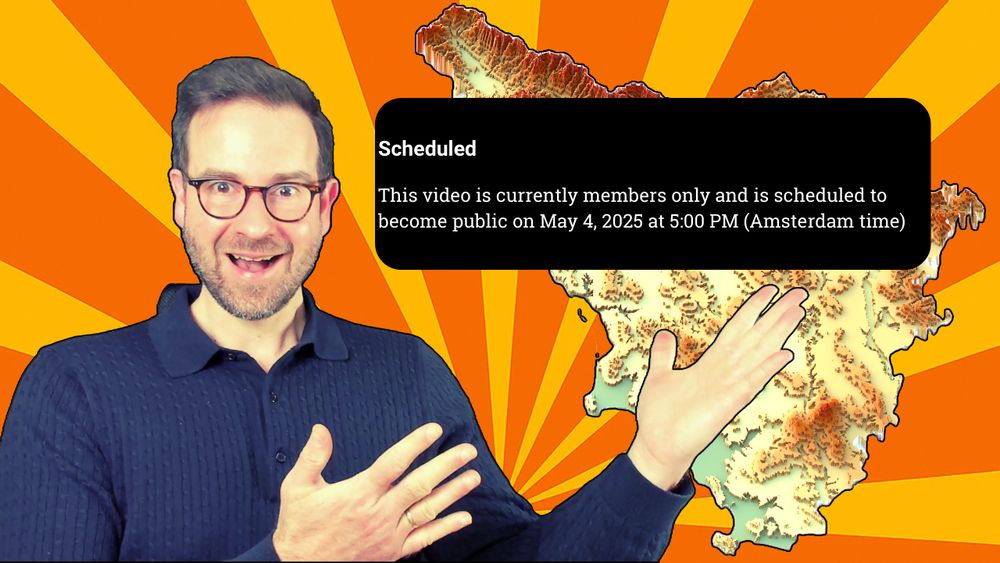
- 🗻 Just finished rendering this Digital Elevation Model of #Jammu & #Kashmir using #Tanaka Highlights 🎨 Loving how the technique brings out the terrain, sharp ridgelines, soft basins, and deep valleys all pop beautifully. 🔗Tut by @milos-makes-maps.bsky.social 😍 #DEM #TanakaHighlights #Cartography
- 🌄 Master the Art of Relief Maps with Tanaka Highlights! Discover how to transform your geospatial data into stunning contour maps and 3D terrains using the Tanaka method. 👉 Watch now: 🔗 youtu.be/q4GIQGRnTNI
- 🚨 Premiere alert! 🚨 On 4 May, 17:00 (Amsterdam time) I’m dropping a brand-new tutorial that turns raw elevation data into eye-popping relief maps. Map nerds, hit the 🔔 and set a reminder so you don’t miss the magic 👇🏻 youtu.be/q4GIQGRnTNI
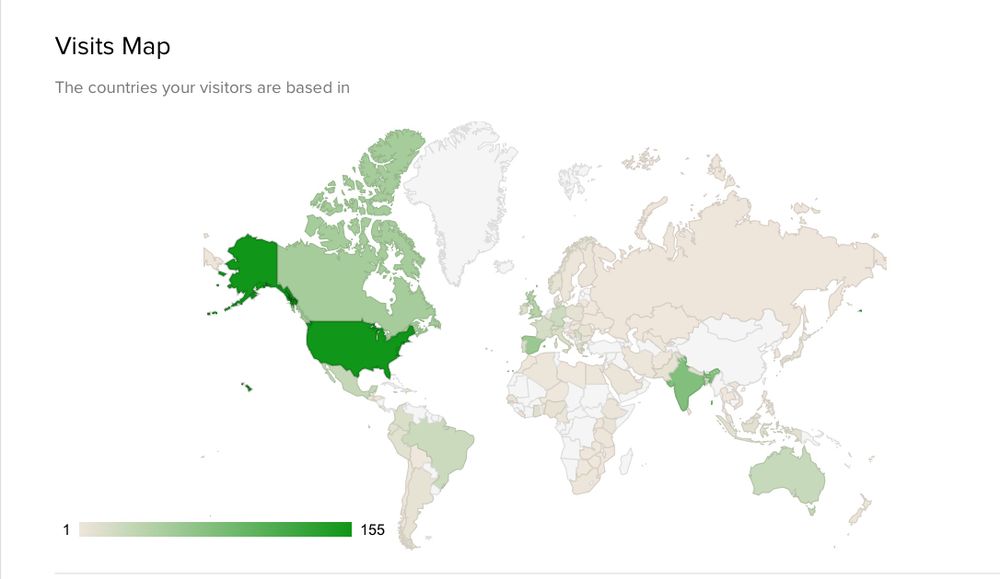
- Yesterday I launched my very first digital book. And, wow, your response has been incredible! I’m grateful for the overwhelming interest & all the positive feedback. Here’s a Payhip map showing our community stretching to nearly every corner of the globe. Thank you for making this journey special!
- After years of coding, teaching, & sharing insights on my YouTube channel, I published my brand-new digital book Mapping the World with R: Your Journey from Beginner to Data Cartographer! What's Inside ⤵️ ✅11 Projects ✅40+ Hands-On Examples ✅Authentic datasets Grab Your Copy 👉 payhip.com/b/MH9Ot
- I'm excited to get started Milos (so far I've done a lot of dataviz, including with R, but no mapping!), thanks for making all these great resources!
- Fantastic! I hope that the book will be a reliable springboard into your advanced mapping!
- After years of coding, teaching, & sharing insights on my YouTube channel, I published my brand-new digital book Mapping the World with R: Your Journey from Beginner to Data Cartographer! What's Inside ⤵️ ✅11 Projects ✅40+ Hands-On Examples ✅Authentic datasets Grab Your Copy 👉 payhip.com/b/MH9Ot
-
View full threadthank you!
- Thank you for sharing my post and following my work!
- 🎁 Special Launch Offer: Use the coupon code MAPWORLDS50 at checkout to receive a 50% discount. Hurry: this offer is limited to the first 50 readers! ⤵️
- After years of coding, teaching, & sharing insights on my YouTube channel, I published my brand-new digital book Mapping the World with R: Your Journey from Beginner to Data Cartographer! What's Inside ⤵️ ✅11 Projects ✅40+ Hands-On Examples ✅Authentic datasets Grab Your Copy 👉 payhip.com/b/MH9Ot
- 🎁 Special Launch Offer: Use the coupon code MAPWORLDS50 at checkout to receive a 50% discount. Hurry: this offer is limited to the first 50 readers!
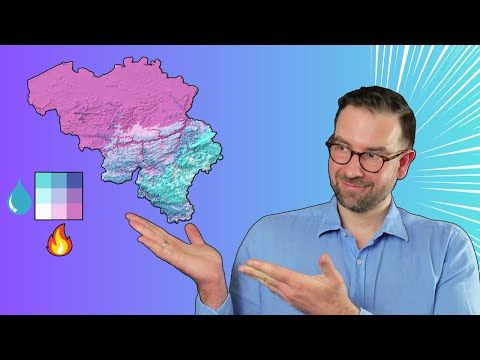
- Climate datasets are everywhere, but how do we blend temperature🔥 and rainfall💧 into one dynamic map? My new video unveils the secret to creating 3D bivariate maps that merge these two crucial measures. Prepare to be surprised by what you uncover! Watch here 👉 youtu.be/EECMHPn2Iuc
- Thank you for your support from Day 1!
- Thank you so much for the mention! I’m thrilled to see my tutorial helping bring these critical insights to light. For anyone interested in how to create such impactful visualizations using high-res data in R, be sure to check out my video tutorial 👇🏻 youtu.be/EECMHPn2Iuc #DataViz #GIS #Rstats
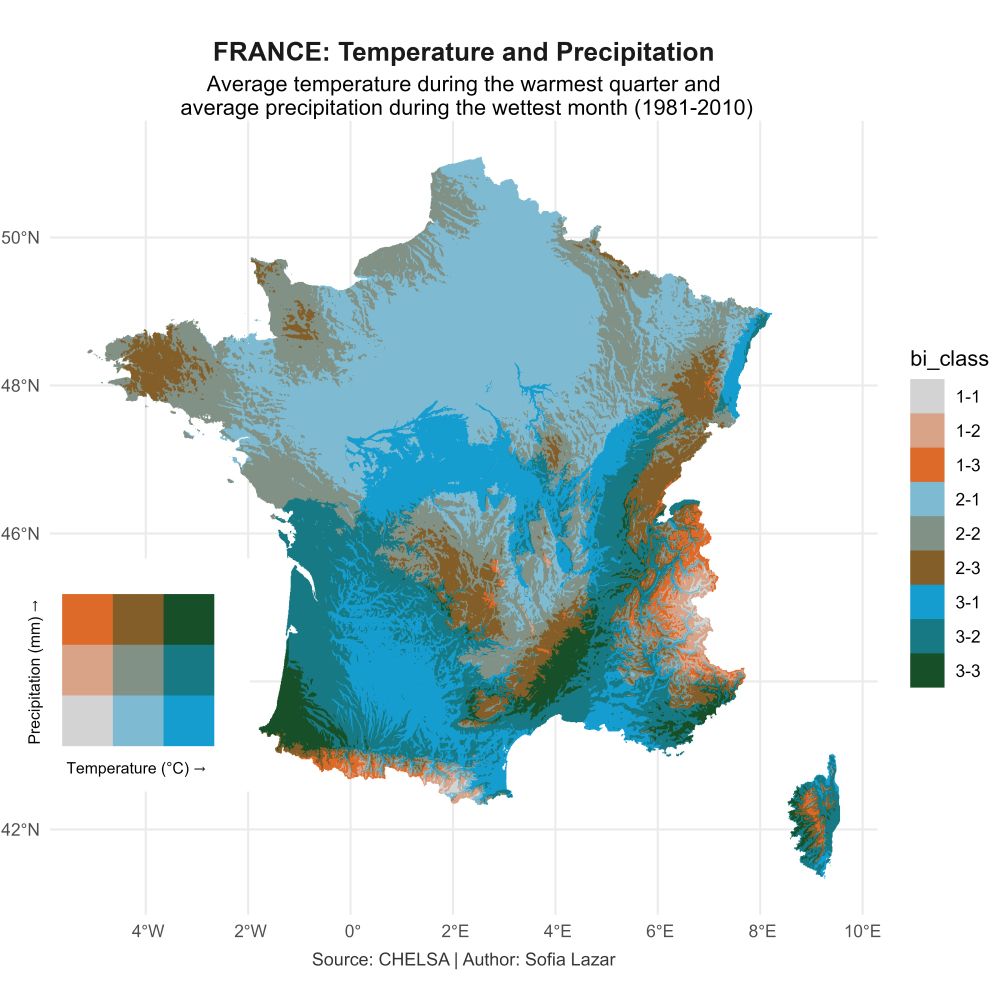
- 🇫🇷 France’s Climate Risks at a Glance 🔴⚪🔵 Using high-res #CHELSA climate data, I mapped the alarming trends: 🌡️ Temps rising 2× faster than global average 🌧️ Rainfall dropping, crops & soil at risk Big thanks to @milos-makes-maps.bsky.social tut! #ClimateEmergency #France #Sustainability #Rstats
 Milos, do you have any written tutorials or a github repo with R code for those of us who are not patient enough to sit through a youtube tutorial? Thank you!
- Hi, every video is accompanied with a GitHub repo with ooen source code. Check in the description box of the video
- Climate datasets are everywhere, but how do we blend temperature🔥 and rainfall💧 into one dynamic map? My new video unveils the secret to creating 3D bivariate maps that merge these two crucial measures. Prepare to be surprised by what you uncover! Watch here 👉 youtu.be/EECMHPn2Iuc
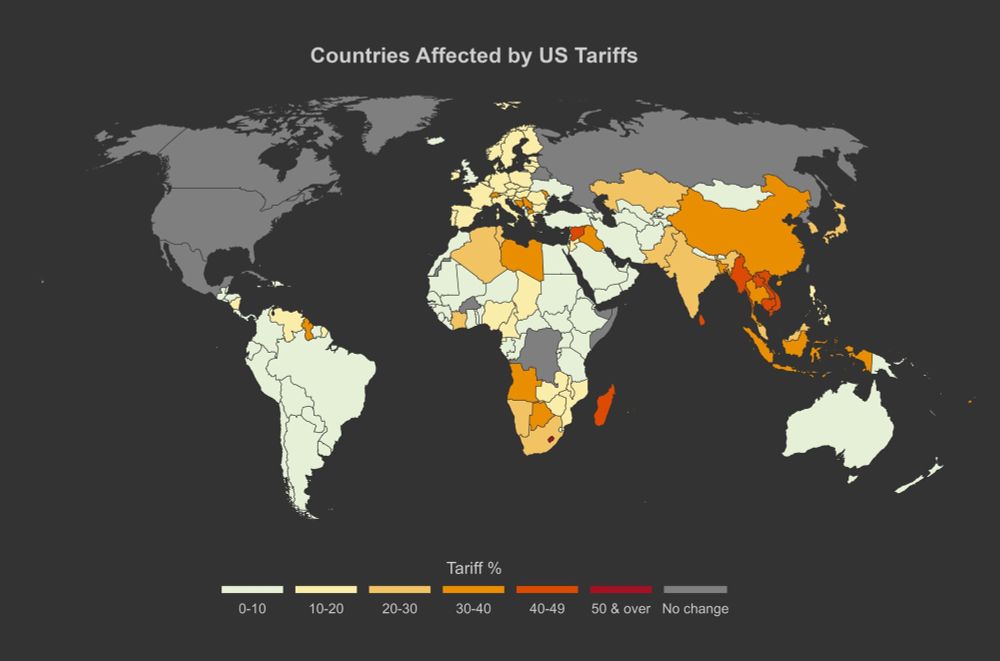
- Who’s feeling the heat from US tariffs? My new map breaks it down. Some countries are at just 10%, and others? No change at all. Where does your country stand? #USTariffs #tariffs
- 🎉 Big milestone today: 350,000 views on my YouTube channel 👉🏻 youtube.com/@milos-makes... I’m grateful for every single viewer, subscriber, and map enthusiast who’s joined me on this incredible journey. Can’t wait to create even more exciting mapping content for you all. Cheers!
- This achievement is highly deserved Milos!!! This is due to the high quality content you produce. Many congratulations. Thanks for all your hard work!
- Thank you, Ignacio!
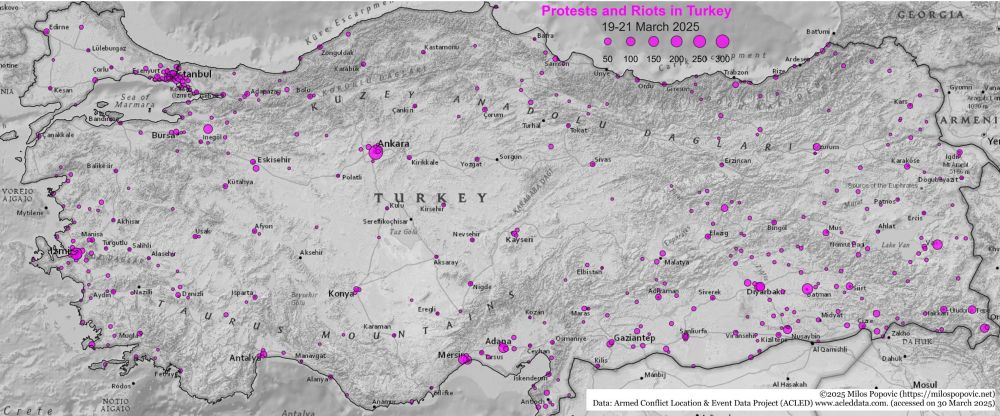
- My new map shows over 4600 protests and riots in Turkey/Türkiye🇹🇷 (19 March - 21 March) Data: @acleddata.bsky.social #GIS #DirenGezi #DirenAmasya #turkiye #turkey #diren
- great work @milos-makes-maps.bsky.social
- Thanks, plan to release more if the protests survive 😁
- exciting (beta of a= #mapping #datavis project where one can see crucial physical infrastructure (undersea cables, powerlines, harbours, etc... ) and also see ship/plane positions. good for #osint investigating potential hybrid activity against important infrastructure
- Early access at demo.atlaslibre.com (click the 'bug' icon to load the sample dataset) bsky.app/profile/pa.n...
- This is a gem Miska, thanks for tagging me!
- Been diving into some map-making stuff lately and came across Milos Popovic’s blog. Super clear tutorials on making beautiful maps. If you’re into maps or just want to make your data look awesome, check it out milospopovic.net Profile: @milos-makes-maps.bsky.social
- Thank you, Praveen, for your heartfelt shout-out! These days I only post video tutorials on YouTube but hope to go back to writing this year
- Nice work--congratulations!
- Thank you Tyler!
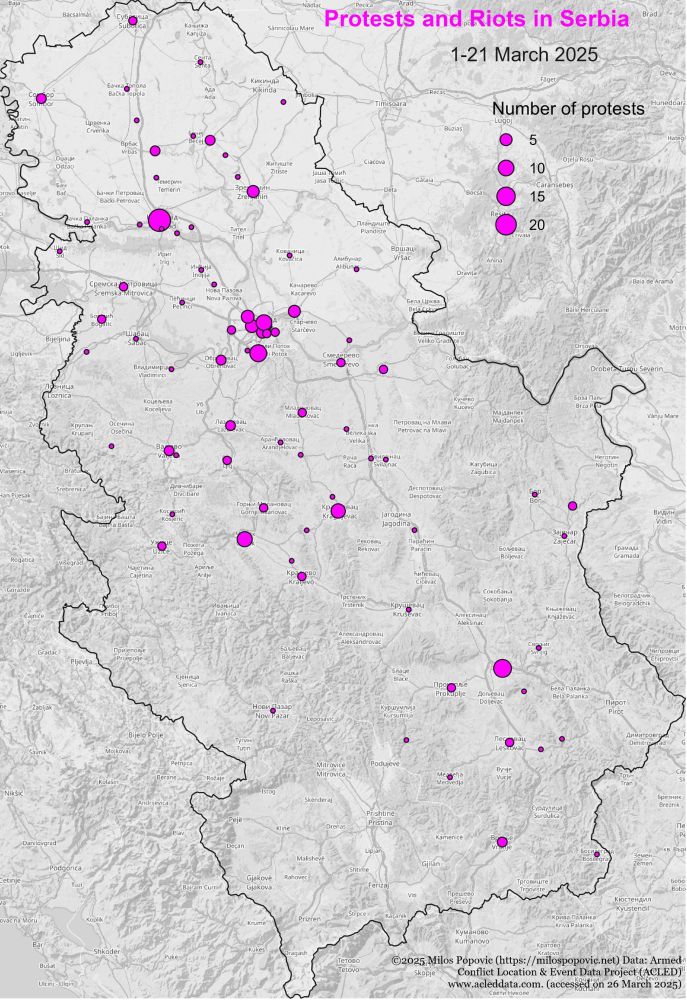
- More than 200 protests and riots in Serbia (1-21 March 2025), according to @acleddata.bsky.social data #gis #maps
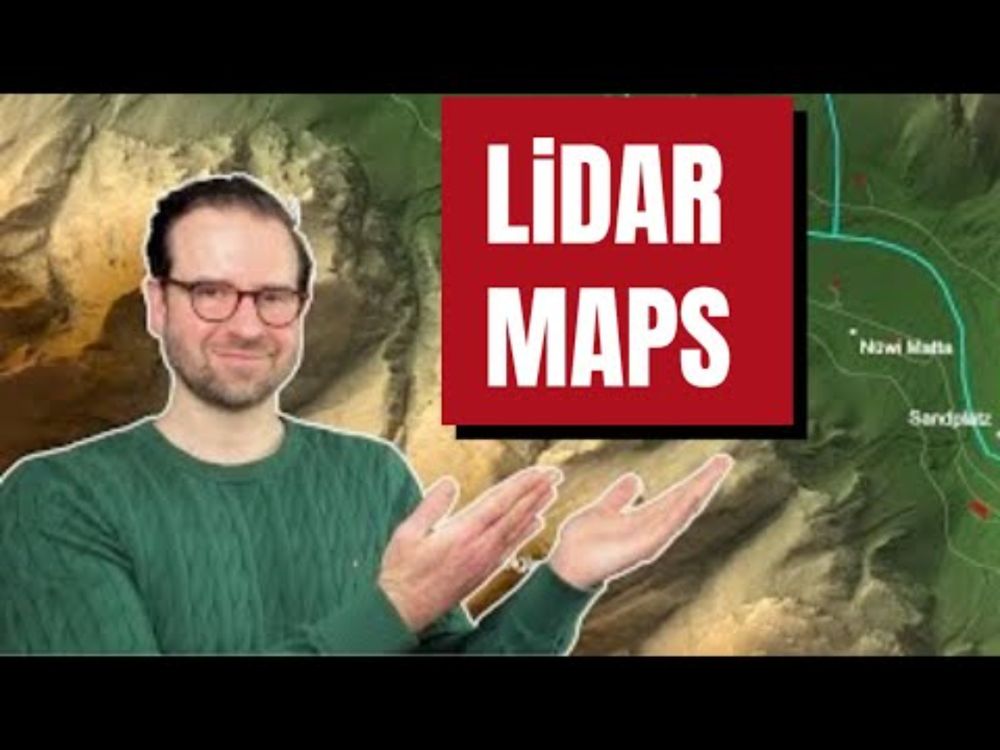
- 🌎 𝗦𝘁𝗿𝘂𝗴𝗴𝗹𝗶𝗻𝗴 𝘄𝗶𝘁𝗵 𝗯𝗹𝘂𝗿𝗿𝘆 𝟯𝗗 𝗺𝗮𝗽𝘀 𝗳𝗿𝗼𝗺 𝗟𝗶𝗗𝗔𝗥 𝗱𝗮𝘁𝗮? I've got your back! My new video shows you how to easily access LiDAR terrain data from not one, but 7 reputable sources—and turn them into stunning, crystal-clear 3D visuals like this one 👇 Watch now: youtu.be/N-AtAnXrGm0 #GIS #maps #LiDAR #DEM
- Struggling with fuzzy 3D maps from LiDAR data? This weekend, I’m releasing a free course that shows you how to turn multiple LiDAR terrain datasets into crisp, next-level 3D maps. Ready to go from “just okay” to “wow”? Subscribe now and be the first to dive into it: youtube.com/@milos-makes...
- 🎈Today I'm celebrating two years of Milos Makes Maps on YouTube! Thank YOU for 18K subscribers & 70+ tutorials. Your feedback like 💬 “These tutorials are a game-changer!” inspires me every day. Join our mapping adventure & level up your skills 👉 youtube.com/@milos-makes...
- Late thanks from here for excellent going!
- Thank you good Miska!
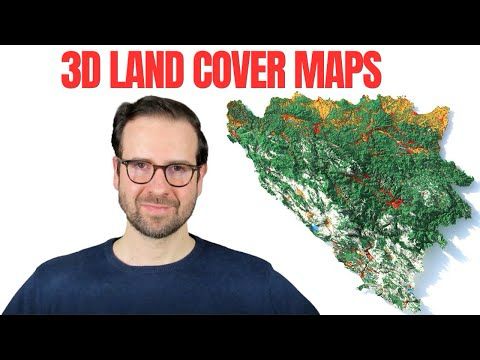
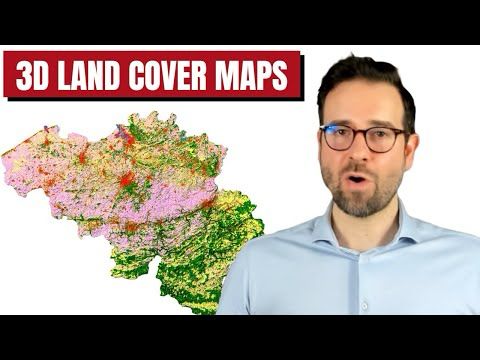
- 🌍Land cover data is key to understanding our planet—from environmental monitoring to urban planning. Ready to transform complex datasets into captivating 3D visuals? Here are 9 FREE tutorials to kickstart your journey 🧵👇🏻👇🏻👇🏻
-
View full thread9️⃣ Visualizing City Land Cover at a Glance Using Microsoft’s Planetary Computer STAC API, map Earth’s land cover—from green forests to urban areas—with R. 📽️ Tutorial: youtu.be/r0Iv_lG6JmA
- Land covee maps go beyond static visuals. In fact, they immerse viewers in the data, making insights clearer and more impactful. Which type of map will you create first? Let’s discuss below! 👇🏻 #GIS #3DMapping #DataVisualization #Rayshader #MappingTutorials #OpenData bsky.app/profile/milo...
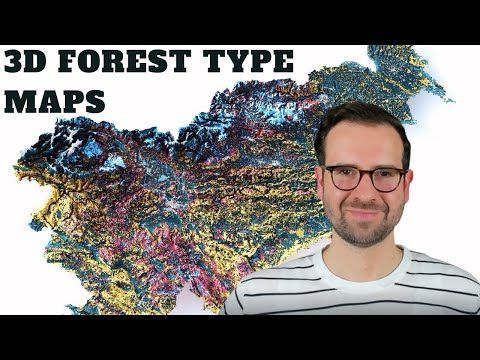
- 7️⃣ 3D Forest Type Maps Create a 3D elevation map overlaid with forest-type values derived from the Copernicus Global Land Cover project. 📽️ Tutorial: youtu.be/MFbJrjpf_2M
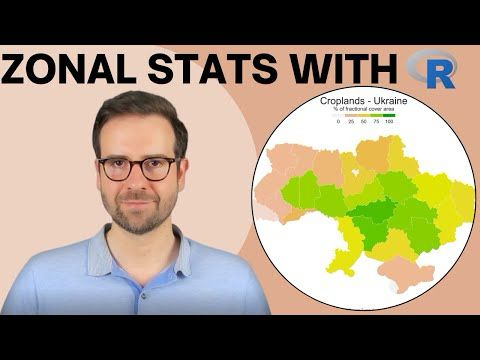
- 8️⃣ Zonal Statistics of Land Cover Classes Using MODIS Satellite Data Unlock the potential of MODIS data and harness the power of R to run and visualize zonal statistics of land cover classes. 📽️ Tutorial: youtu.be/3cSDYKQg1xw
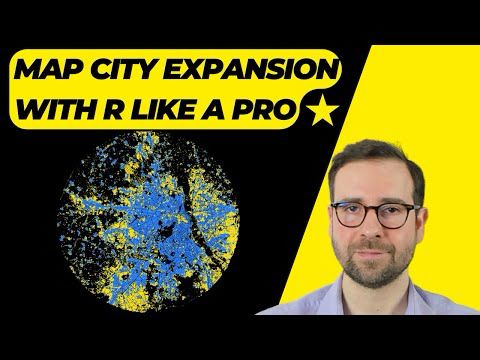
- 5️⃣ Mapping Built-Up Cover Changes Over Time with R Visualize how built-up cover changes over time using the GLAD dataset. 📽️ Tutorial: youtu.be/JfDW8P51MmA
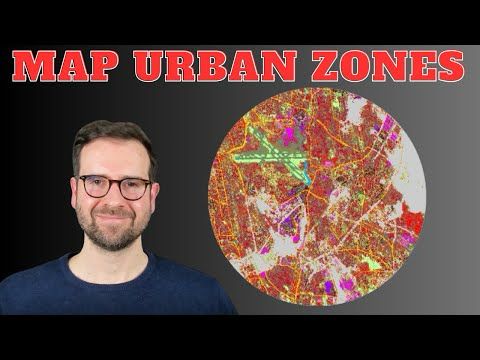
- 6️⃣ Map Urban Area Types Use ggplot2 in R to create maps of Morphological Settlement Zones—clusters of built-up cells with similar characteristics. 📽️ Tutorial: youtu.be/_lCnJUApphg
- 6️⃣ Map Urban Area Types Use ggplot2 in R to create maps of Morphological Settlement Zones—clusters of built-up cells with similar characteristics. 📽️ Tutorial: youtu.be/_lCnJUApphg
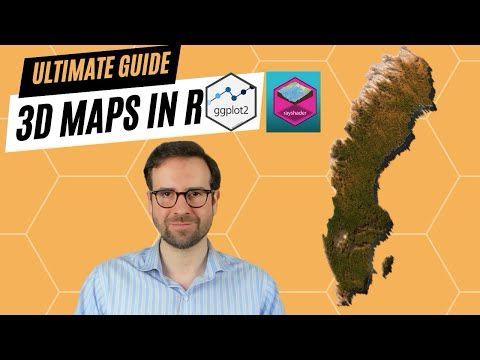
- 3️⃣ 3D Forest Cover Maps with rayshader and ggplot2 in R Learn how to transform 2D forest data into interactive 3D visualizations using rayshader and ggplot2. 📽️ Tutorial: youtu.be/bvlB5yb_uVQ
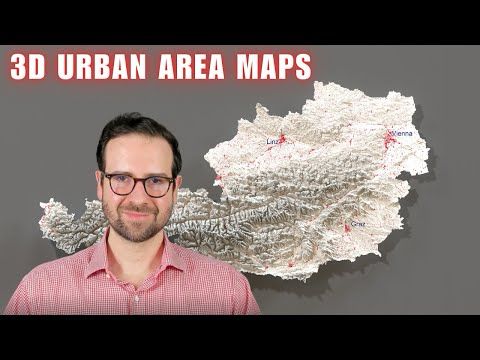
- 4️⃣ 3D Elevation and Urban Area Maps with R Discover how to create stunning 3D maps of urban areas using R and Global Human Settlement Layer data. 📽️ Tutorial: youtu.be/K5Qf6QLSKnI
- 1️⃣ Esri Land Cover Dataset in 3D 🌍Visualize global land cover using Sentinel-2 data from the Esri Living Atlas. Explore how urban, agricultural, and natural areas coexist. 📽️ Tutorial: youtu.be/y_Kzg24Ciuo
- 2️⃣ Create Stunning 3D Land Cover Maps in R Programming! Join me on an adventure to create breathtaking 2D and 3D land cover maps using the ESA Global Land Cover dataset. 📽️ Tutorial: youtu.be/EuLip_J0x3I
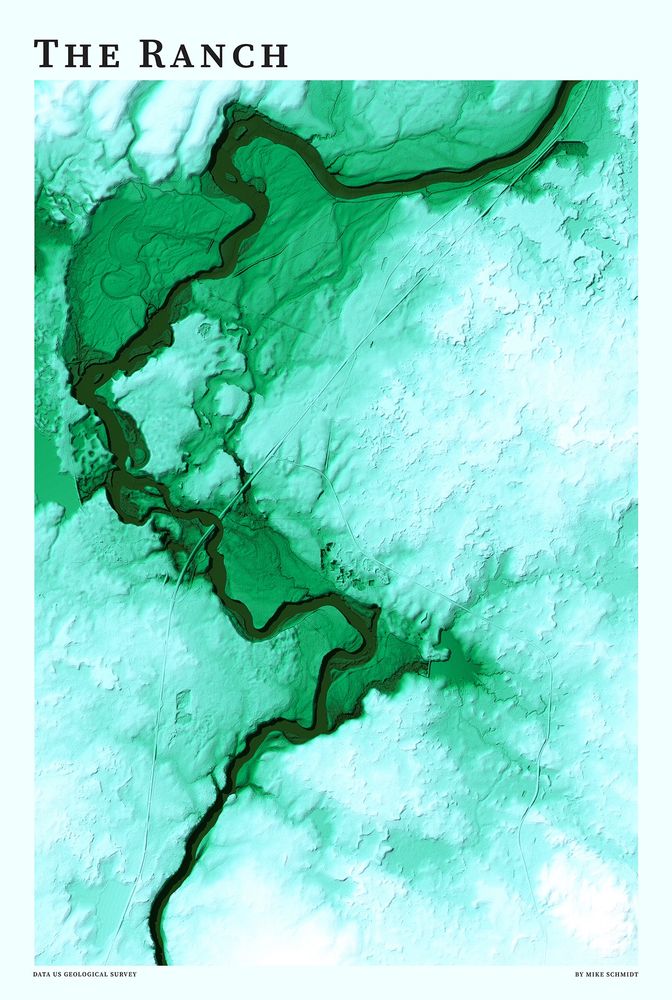
- Thsnks for sharing your incredible 3D REM and the personal story behind it! For anyone curious about how to create these types of maps, feel free to check out my video tutorial on YouTube 👇🏻 youtu.be/x8is770F7Og
- Made my first 3D REM (River Elevation Model). Couldn’t have done it without @milos-makes-maps.bsky.social tutorial on his YouTube channel. The location is one of the finist fly fishing destinations in the world. I spent a lot of my childhood on these banks. #ifyouknowyouknow #rstats
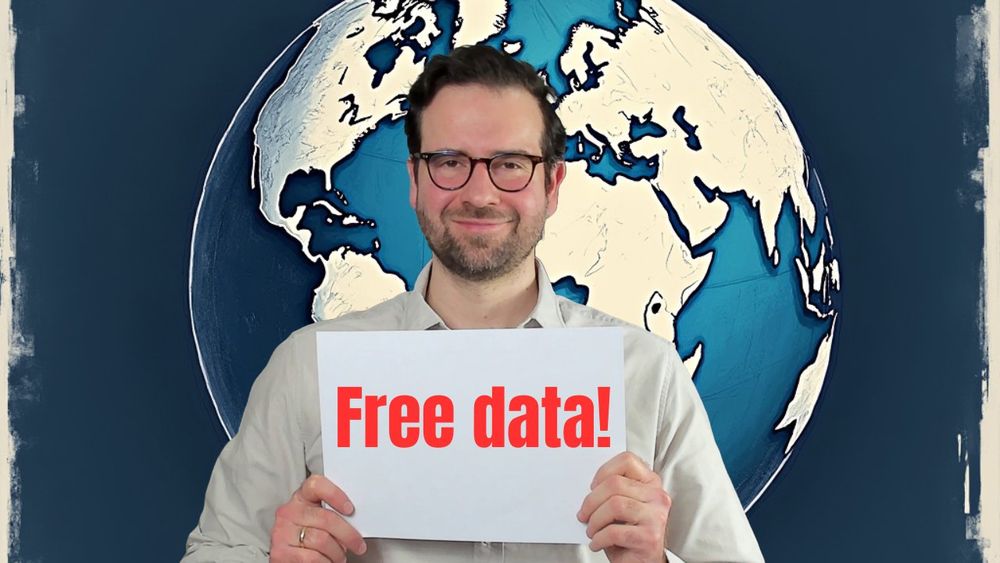
- 🌍10 FREE GIS Data Sources to Supercharge Your Maps 1️⃣ GADM Boundaries ▶️ youtube.com/watch?v=JdivG_… 2️⃣ OpenStreetMap (OSM) ▶��� youtube.com/watch?v=JdivG_��G_… 3️⃣ ESA World Cover 2021 ▶️ youtube.com/watch?v=JdivG_… 4️⃣ Natural Earth ▶️ youtube.com/watch?v=JdivG_… pic.x.com/n4vVnzckIn 👇🏻
- 5️⃣AWS Terrain Tiles youtube.com/watch?v=JdivG_… 6️⃣Sentinel-2 Imagery youtube.com/watch?v=JdivG_��� 7️⃣WorldClim ▶️ youtube.com/watch?v=JdivG_… 8️⃣GBIF ▶️ youtube.com/watch?v=JdivG_… 9️⃣Tree Height ▶️ youtube.com/watch?v=JdivG_… 1️⃣0���⃣WorldPop ▶️ youtube.e.com/watch?v=JdivG_… pic.x.com/QL2mpGbNAE
- We must thank you for sharing such wonderful tutorials. Thank you @milos-makes-maps.bsky.social
- 🎈Today I'm celebrating two years of Milos Makes Maps on YouTube! Thank YOU for 18K subscribers & 70+ tutorials. Your feedback like 💬 “These tutorials are a game-changer!” inspires me every day. Join our mapping adventure & level up your skills 👉 youtube.com/@milos-makes...
- Thank you for being a strong supporter of my channel from Day 1, Luis!
- Really appreciate your tutorials, I always find something to help me when I’m stuck
- Thank you so much! If you ever have questions or ideas for future content, feel free to let me know, always glad to help!