
Elliott Wave International
We are Elliott Wave International. Guiding investors in the markets since 1979.
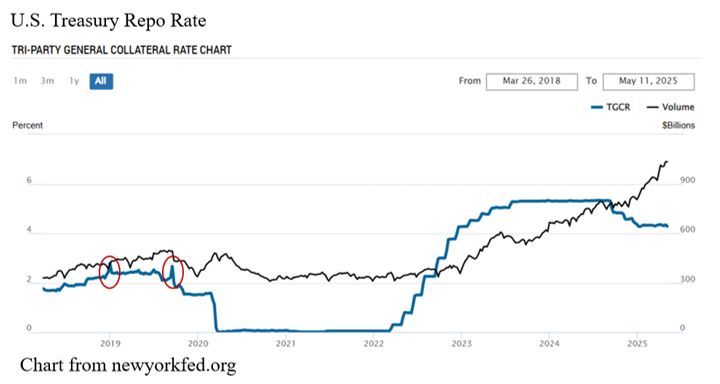
- Markets have calmed a bit, but the deeper risks haven’t gone anywhere. The chart shows why I'm still paying close attention. While the Treasury repo rate stayed steady last month, volume has exploded-especially since 2023.
- That surge is largely driven by hedge funds using massive leverage (50–100x) to execute the 'basis trade'-profiting from small pricing discrepancies by borrowing in the repo market.
- If repo rates spike, that trade breaks. Funds could unwind, triggering a wave of bond sales. If the Treasury market freezes, it’s not just a financial glitch-it’s a systemic event. The stability came down to confidence. But with this much leverage in the system, confidence can vanish fast.
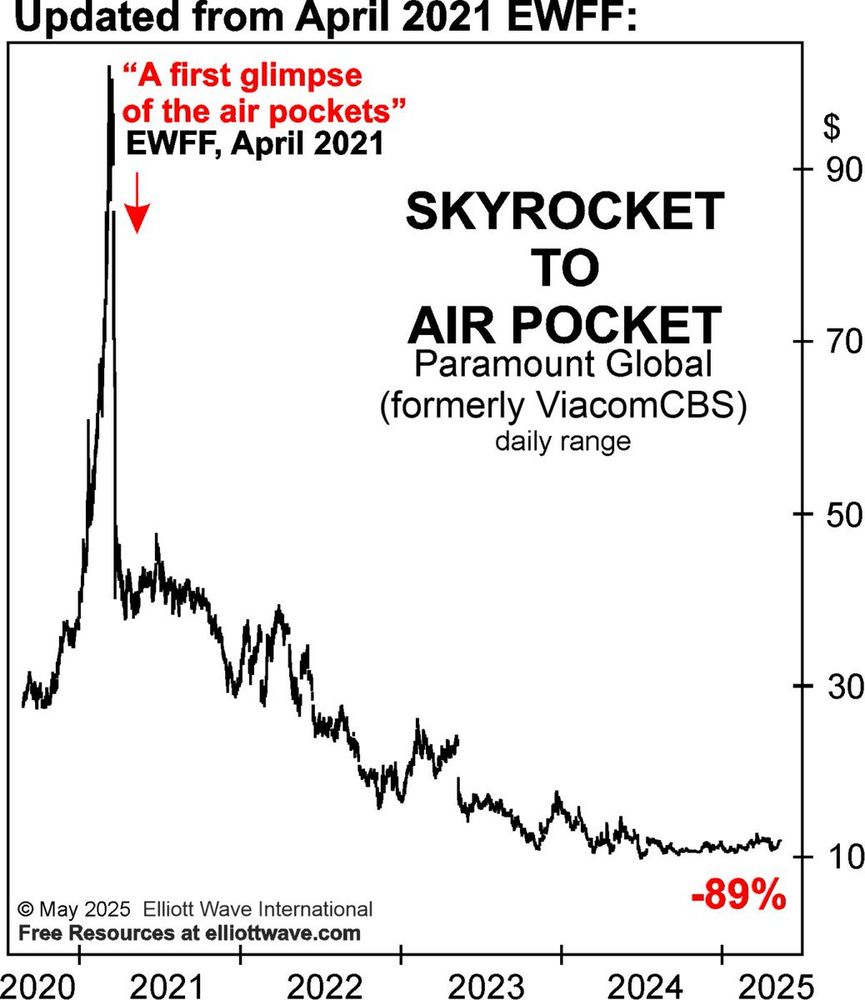
- 🚨 From Skyrocket to Air Pocket In April 2021, we warned subscribers that ViacomCBS (now Paramount Global) was just getting its "first glimpse of the air pockets." Since then? #PARA is down 89%. Get our latest insights - free! #StockMarket #CBS #investing #investingtips #TradingSignals #recession
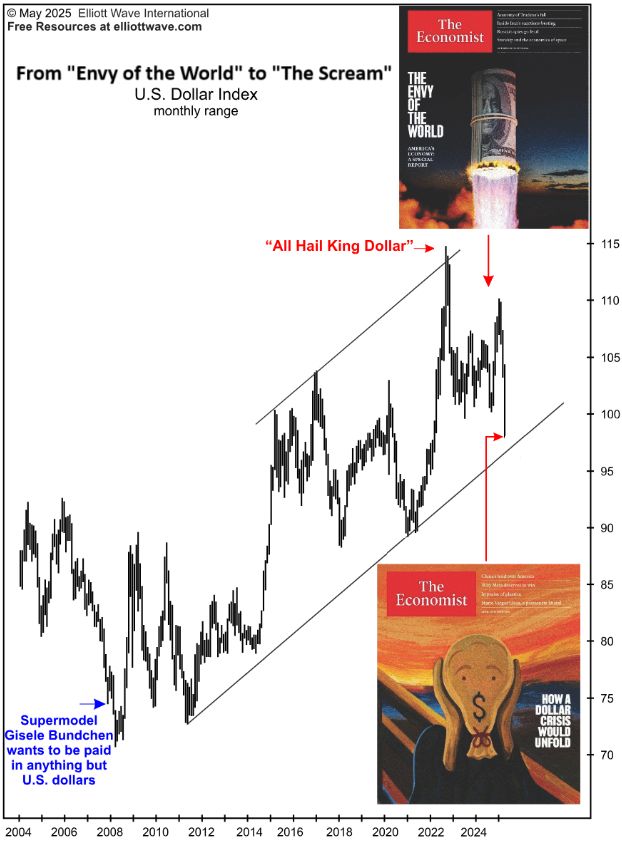
- 🚨💸 #USD - From “The Envy of the World” to “The Scream” — the U.S. Dollar just completed a round trip in sentiment. Read the full issue: ow.ly/jB5b50VS6i4
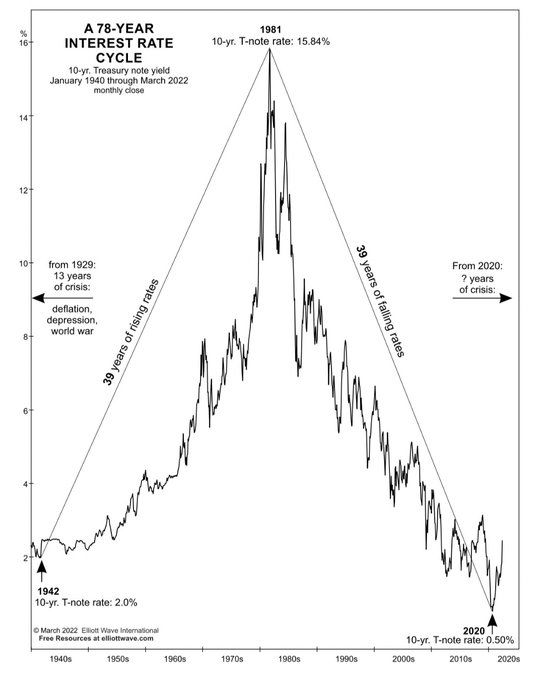
- 10 year rates rose tenfold from their 2020 low! Think that’s the end of the move? #elliottwave #bonds #interestrates
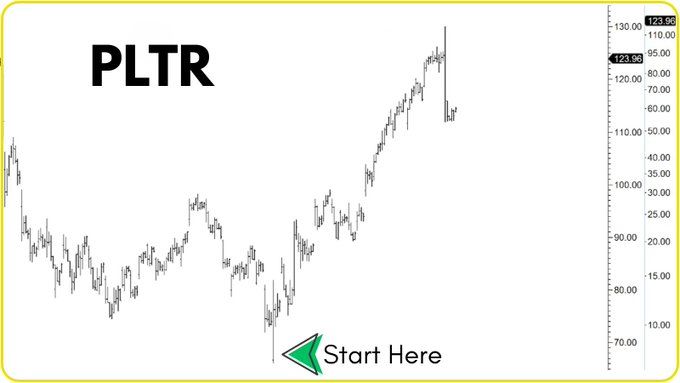
- 📈 Label this chart! Try your hand at labeling this price chart of #Palantir. Drop your labeled chart in the comments and check back for the Trader's Classroom chart. #Elliottwave #technicalanalysis #stockmarket #stocktrading #daytrading #tradingtips #tradingstrategy #PLTR
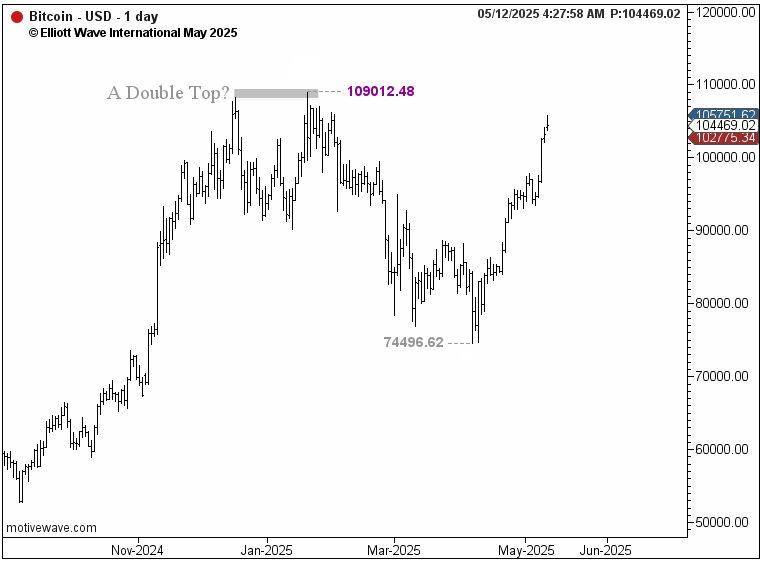
- 🚨 Bitcoin is near its inauguration-day high of $109,012. Global stocks are also pressing against their February peaks. Was the recent decline in bitcoin just a corrective dip? This week could be crucial in determining what comes next. #Bitcoin #Crypto #StockMarket #Elliottwave #TechnicalAnalysis
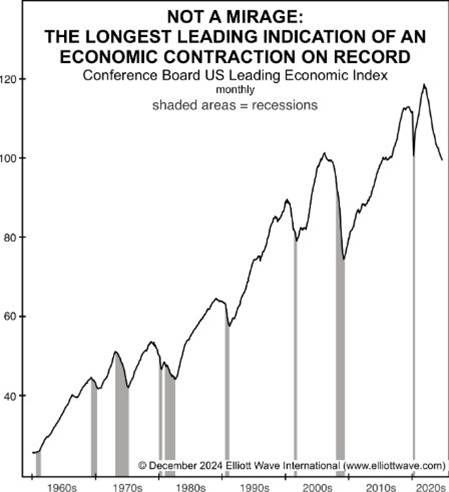
- Is the U.S. economic contraction of 0.3% in Q1 a warning of what’s ahead? A month before the start of Q1, our December Elliott Wave Financial Forecast laid out data which spoke for itself – and the message still applies: #economy #stockmarket #stocks #recession #markettrend #investing #bearmarket
- "The chart shows that the Conference Board’s Leading Economic Index (LEI) peaked in December 2021. The index has not had an uptick for 32 consecutive months, since February 2022. It’s now at its lowest level since March 2016."
- "The current LEI decline is a Fibonacci 34 months old, starting at the December 2021 high... The longest LEI decline prior to a recession was a Fibonacci 21 months, from March 2006 to December 2007. It was followed by the steepest economic contraction since the Great Depression."
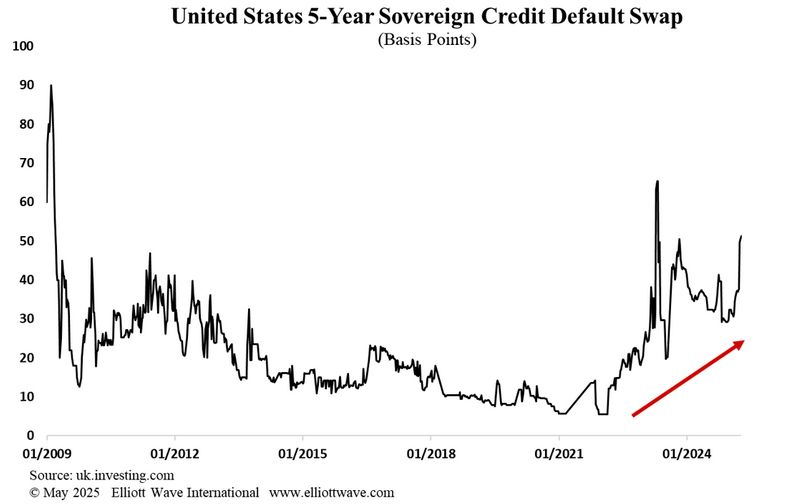
- 🚨The market-based estimation of the U.S. defaulting over the next five years has risen sharply over the past month. Get expert market insights: ow.ly/ZTvg50VPvuW
- Murray Gunn sits down with Luiz Fernando Roxo to discuss Elliott Wave analysis, credit markets, bitcoin, gold and more. www.youtube.com/watch?v=rG9H...
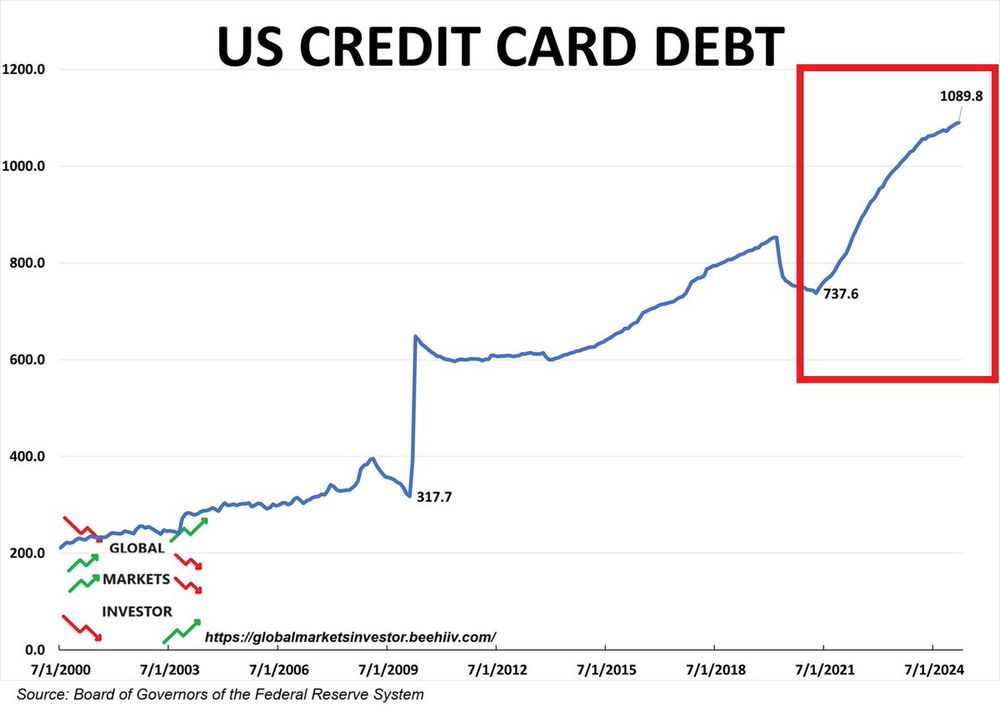
- The age of easy credit at all levels - individual, government and corporate - is ending. Consumers are tapped out. Defaults on U.S. credit card loans have hit record highs. Be prepared for pension cuts, corporate-debt defaults and municipal-government defaults. - Robert Prechter
- Grab the latest Global Market Perspective today! tinyurl.com/bdmudhfu
- ✅Nearly 27% of CMBS loans backed by office properties in metro Atlanta are delinquent—4x worse than 2 years ago. ✅One-third of Atlanta office space is now vacant or subleased. ✅“Lenders don’t want these properties back.” ✅Buildings selling for pennies on the dollar. Cash will be king.
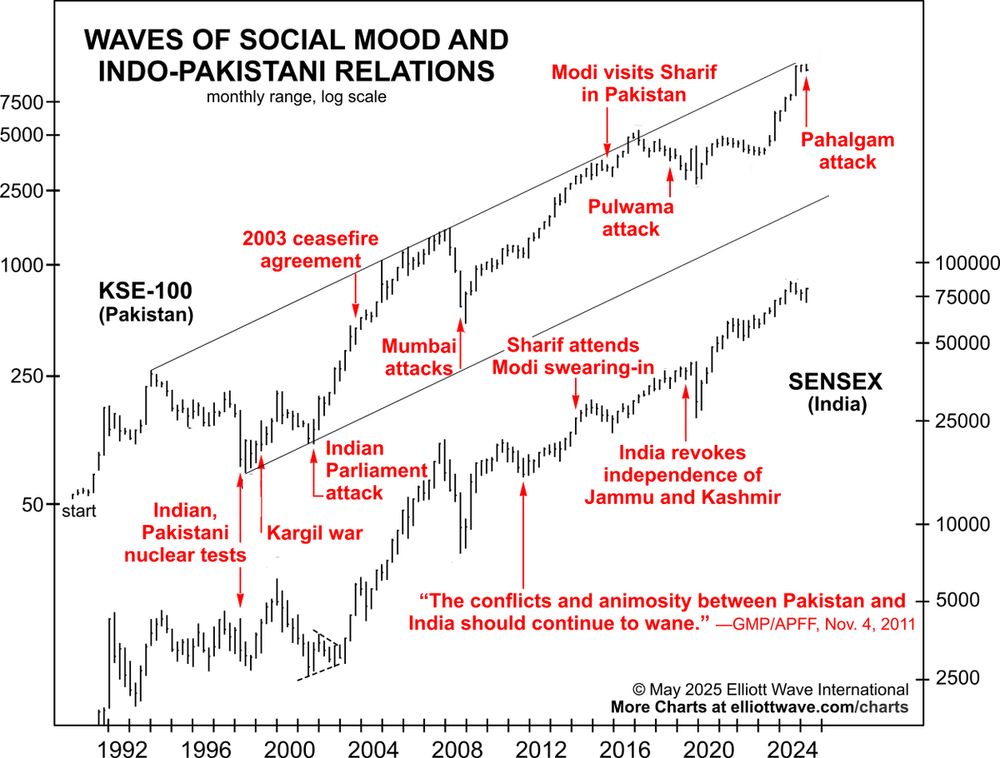
- 🇮🇳🇵🇰 Indo-Pakistani Conflict Intensifies 26 killed in the deadliest Kashmir attack since 2019. India blames Pakistan — Pakistan retaliates The markets warned us this was coming. #India #Pakistan #Kashmir #KashmirTerroristAttack #geopolitics #socionomics #stockmarket
- As the chart shows, major conflict events align with corrections in the KSE-100 and Sensex. Although the attack and the conflict may have occurred early in the KSE's downtrend, they may provide a great excuse for the correction to accelerate.
- Tune in to Global Market Perspective for insights into 50+ major global markets! ow.ly/InSH50VOIRE
- ‼️Free Course! This 1-hour course shows you how to shrink your Elliott wave trade setups down to just 3! These setups are high-confidence, low-risk and easy to spot. Check it out now! ow.ly/xAEO50VIlMb #trading #tradingtips #tradingeducation #elliottwave #technicalanalysis
- Consumer Debt: Propping up the Economy Since 2021 It's time to check under the hood! The engine is not running on premium gasoline in the form of savings but rotting ethanol in the form of debt. See more cool charts and free resources: ow.ly/65wb50VNZC5 #economy #debt
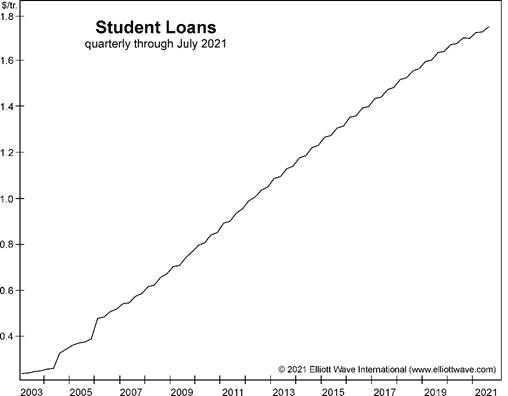
- Student loan collections could resume as early as this month (May)!! Five million borrowers are in default and another four million are in late-stage delinquency. Last Chance to Conquer the Crash warned that the failure rate of student loans would rise.
-
View full threadRead Robert Prechter's Last Chance to Conquer the Crash to see how to prepare yourself for when deflation hits.
- If borrowing continues forever, then deflation won’t happen. Is student-loan borrowing going to continue its upward trajectory? Not a chance. Many students who owe money cannot or will not pay, and the failure rate is rising. Deflation will wipe out most of these debts.
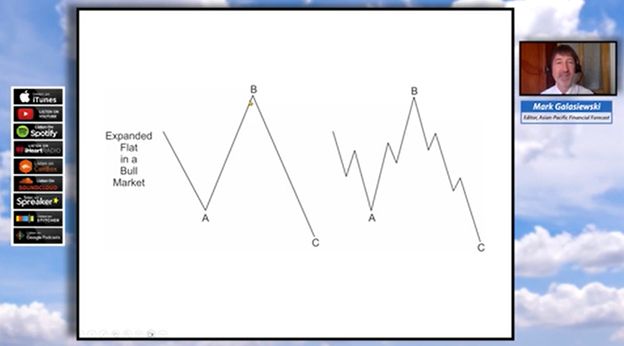
- Check this #Elliottwave pattern! ow.ly/KCVq50VNaEa "This pattern is called an expanded flat. It’s a 3-wave decline labeled A, B, C where wave B rises to a new high above the start of wave A until it finally crashes down in wave C..." #trading #investing #tradingstrategy
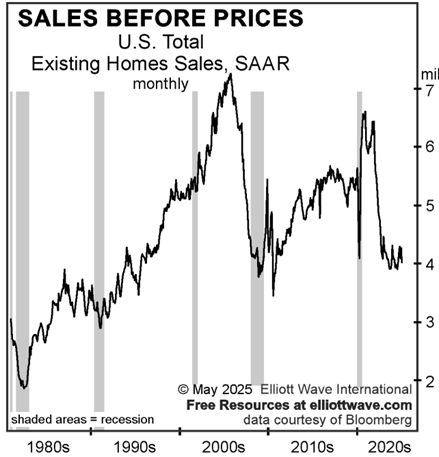
- 🚨Headlines are hyping up the housing market. Do home sales lead the economy? Yes. And history backs it up. From 2005 to 2007, sales fell 39% — right before the 2008 crash. From 2021 to 2025, we’ve seen the same exact percentage drop. #HousingMarket #RealEstate #Recession #ElliottWave
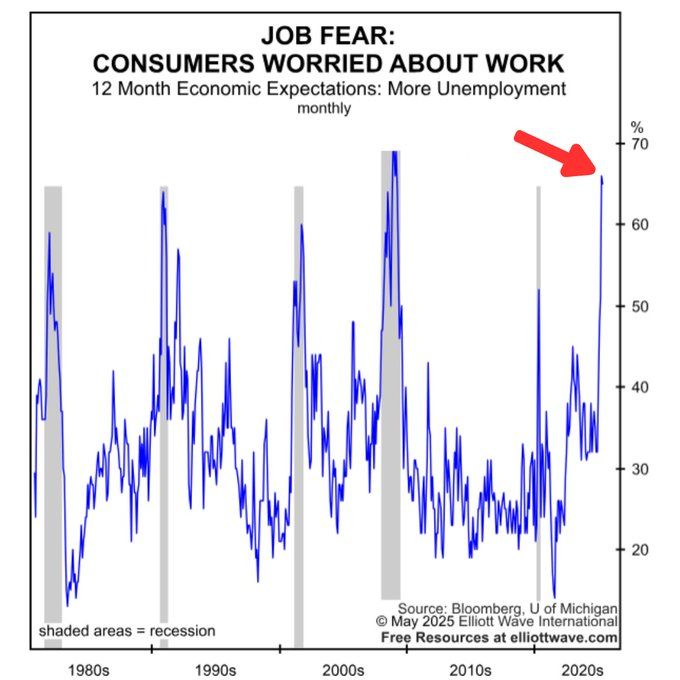
- 🚨Job Loss Fear Spikes! 65% We alerted readers to a pending “boom in unemployment.” 65% of respondents to the U of M monthly consumer survey are worried about losing their jobs. This jolt of fear points to more trouble ahead. #unemployment #economy #recession
- Over the past six months, major currency markets have seen some dramatic moves. Mainstream financial media has largely pointed to two key drivers: - The 2024 U.S. presidential election - The Federal Reserve The real story 🧵
-
View full threadOn April 16, STU had already flagged a notable sentiment shift and the potential for a downturn. The takeaway? While news tends to explain moves after they happen, our analysis focuses on anticipating them -- using Elliott wave patterns and market behavior.
- Want to see what really drives the markets? Check out our free resources or get forecasts for the markets you follow: www.elliottwave.com?utm_source=t...
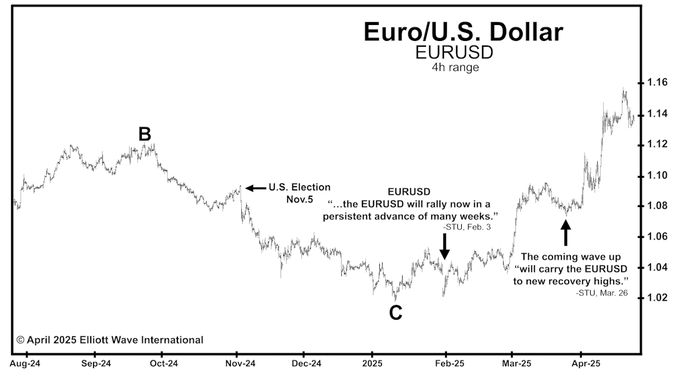
- Fast-forward to January: on the 3rd, GMP anticipated a major reversal in EURUSD. Ten days later, on January 13, STU called for "a multi-month rally" -- which began the very same day.
- As prices climbed into February and March, STU kept subscribers informed of short-term pullbacks and the larger upward trend. And ahead of another sharp move on April 21, financial headlines once again turned to political themes.
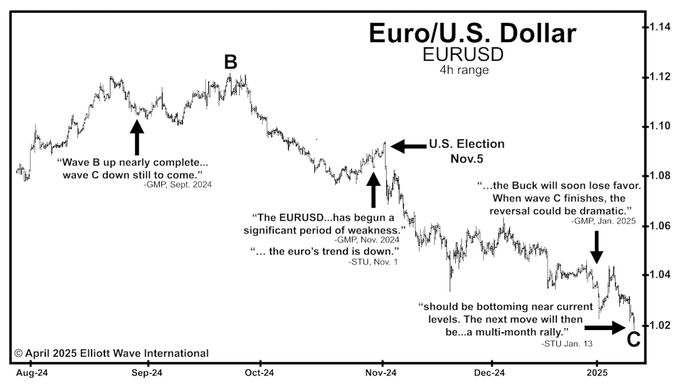
- Our September 2024 Global Market Perspective (GMP) noted that a B wave peak was likely in place, and it projected a downward C wave to follow. That analysis came well before the U.S. election on November 5.
- Then on November 1, just days before the vote, GMP called for "significant weakness" in EURUSD. That same day, our Short Term Update (STU) identified that "the trend is down." This wasn't based on political speculation -- it was based on market patterns we've studied for decades.
- Who was tracking these moves before they happened? Look at #EURUSD -- the world's most actively traded currency pair. From October 2024 to mid-January 2025, the pair declined sharply, reaching a 14-month low.
- [Not loaded yet]
-
View full thread"Elliott wavers might spot a distinct triangle on this chart. That could mean that the current upward thrust in Reverse Repo usage is the last and that a top is nearby.
- When Reverse Repo usage starts to decline, as it will, and begins to return back to historically normal levels of not much above zero, it will be a sure sign that the era of free money is over..."
- [Not loaded yet]
- It’s as if the Fed, by its unprecedented, gargantuan money printing has created a Frankenstein- like monster with the unintended consequence of actually impeding the wheels of finance.