Michael Friendly
ASA Fellow; #rstats developer of graphical methods for categorical and multivariate data; #datavis history of data visualization; #historicaldatavis; Milestones project
Web: www.datavis.ca
GitHub: github.com/friendly
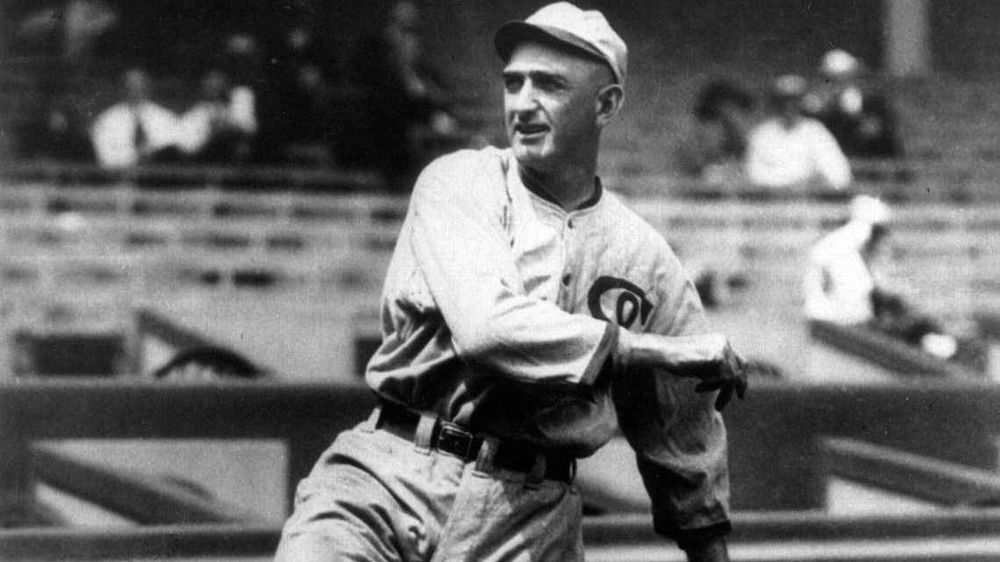
- BREAKING: Shoeless Joe Jackson 'reinstated' by #MLB, now eligible for induction to Hall of Fame. All the data from the 1919 World Series I reviewed showed that w/o a doubt he was innocent of the charge of throwing the series. See: Jay Bennet (1993) bit.ly/3SEOGde
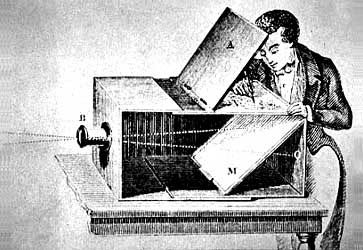
- #TodayinHistory #dataviz #Onthisday #OTD 📊 🎂May 12, 1687 Johann Heinrich Schulze born in Germany 🇩🇪 1719- 1727, his experiments paved the way to the development of photography: Images obtained by action of light on a mixture of chalk, nitric acid, and silver salts 👀 bit.ly/4jQLGGJ
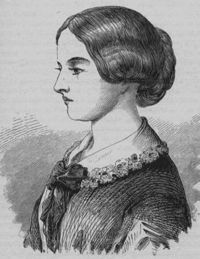
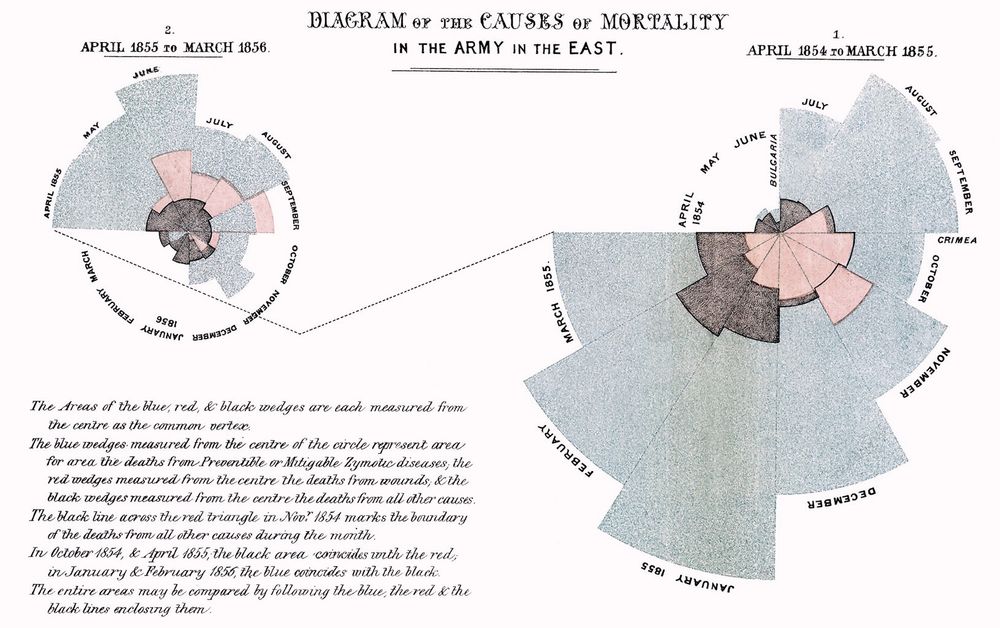
- #TodayinHistory #dataviz #Onthisday #OTD 📊 🎂May 12, 1820 Florence Nightingale born in Florence, Italy 🇮🇹 Her 1858 radial diagrams used to inform & reform medical practice make her a true graphic heroine
- #TodayinHistory #dataviz #Onthisday #OTD 📊 📅May 11, 1892 🎂 Birthday of multiple regression Francis Ysidro Edgeworth in his first Newmarch Lecture, "On the uses and methods of statistics", lays out the ideas of multiple regression. 📔 bit.ly/4j3VpIL
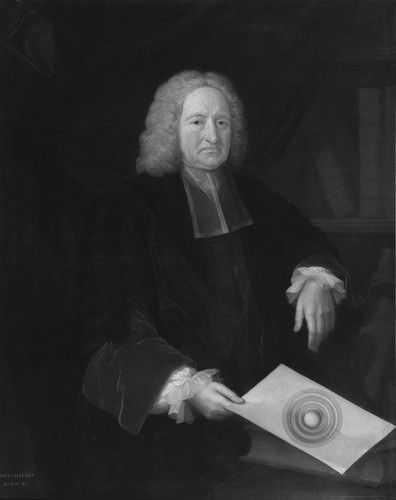
- 📅May 11, 1676 Edmond Halley --- Important observations were recorded at Oxford about the occultation of Mars by the moon, Halley an undergrad! So many, many contributions to observational astronomy! bit.ly/4ddNhUI
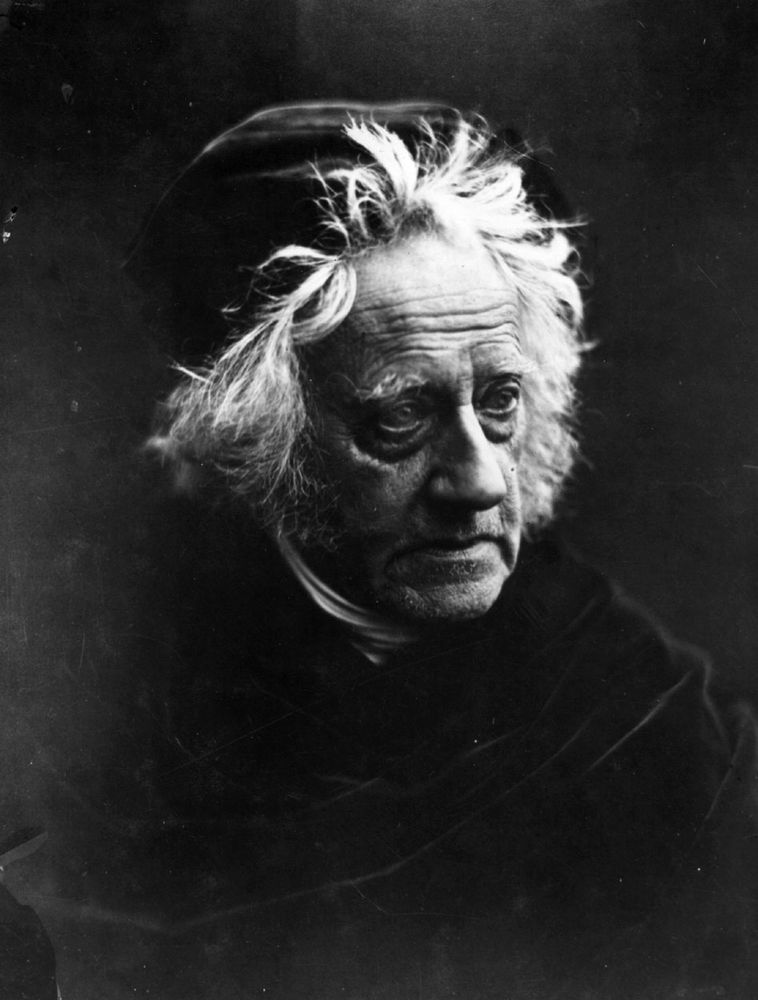
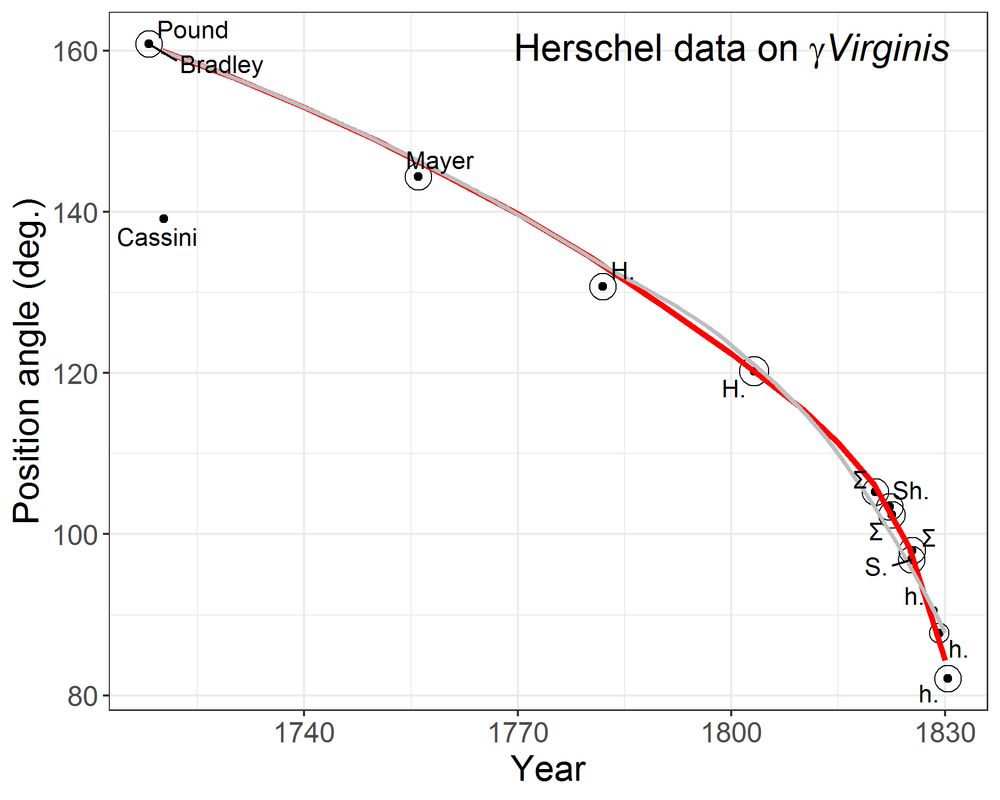
- #TodayinHistory #dataviz #Onthisday #OTD 📊 💀May 11, 1871 John Frederick W. Herschel died in Hawkhurst, Kent, England 🇬🇧 I credit Herschel with the invention of the scatterplot 📰📎 www.datavis.ca/papers/frien...
- #TodayinHistory #dataviz #Onthisday #OTD 📊 🎂May 10, 1899 Mordecai J. B. Ezekial born in Richmond, Virginia, USA 🇺🇸 In 1924, he developed the essential idea behind what are now called partial residual plots -- showing the net relation of a predictor controlling for others.
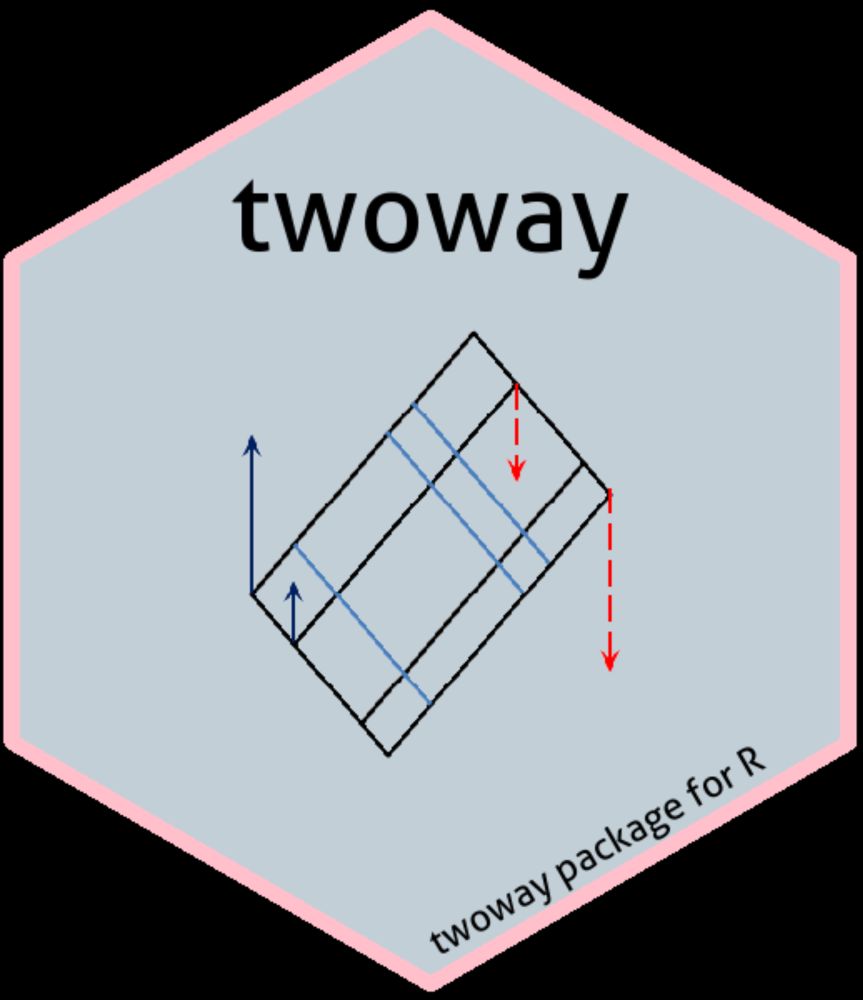
- See the {twoway} #rstats pkg. Does this and much more friendly.github.io/twoway/
- #TodayinHistory #dataviz #Onthisday #OTD 📊 🎂May 9, 1746 Gaspard Monge born in Beaune, France 🇫🇷 Considered the father of descriptive and differential geometry, allowing representation of 3D objects in 2D and lines of curvature on 3D surface bit.ly/4dhpxPE 1/ ⬇️
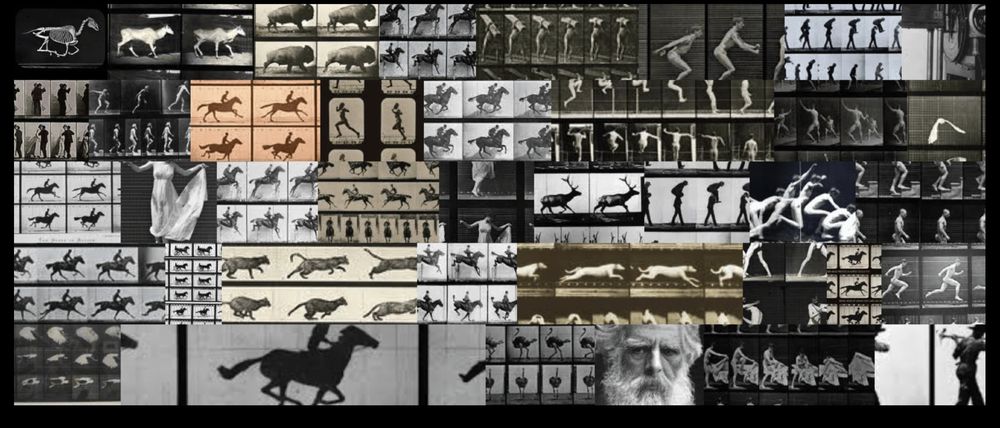
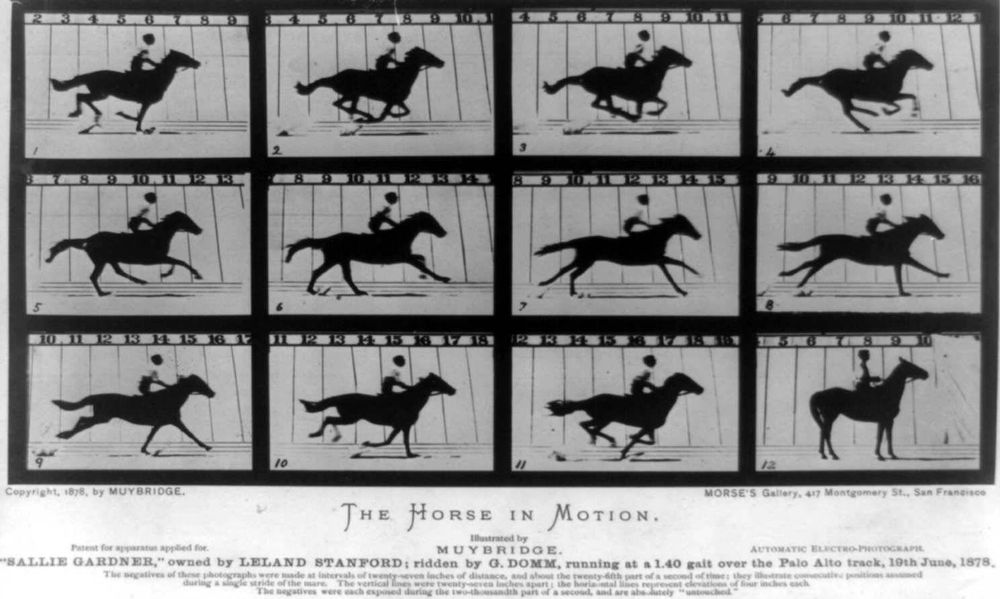
- #TodayinHistory #dataviz #OTD 📊 💀May 8, 1904 Eadweard Muybridge died in Kingston upon Thames, England 🇬🇧 ~ 1875 he developed a system for motion photography from a series of frames & pioneered the study of motion in humans and animals --a precursor of moving pictures & animated graphics.
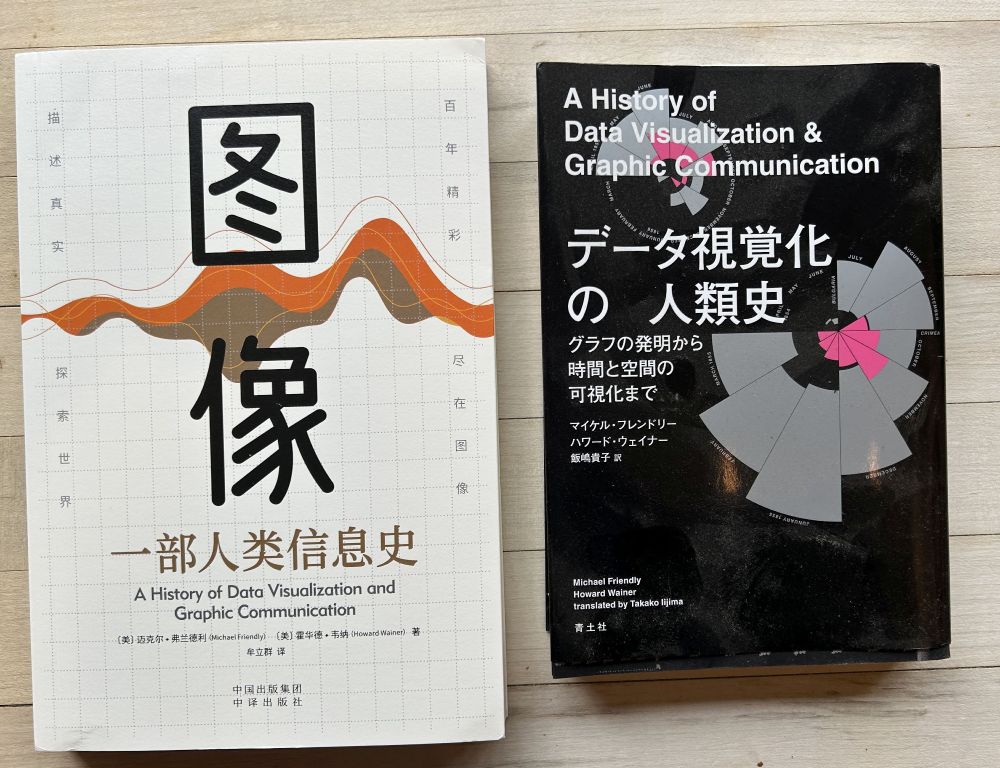
- How about some Chinese? 来点中文怎么样? A Chinese translation of my book, "A History of Data Visualization and Graphical Communication" now joins the Japanese translation. They did a nice job with the layout of figures.
- #TodayinHistory #dataviz #Onthisday #OTD 🎂May 7, 1945 Michael Friendly born in New York City, NY, USA 🇺🇸 Developer of graphical methods for categorical and multivariate data; amateur historian of history of data visualization. Happy Birthday to ME
- Including the total here swamps the scale for the rest. Are you sure you wanted to do that?
- 📊 #dataviz In my #psy6135 Psychology of Data Visualization course students give a capstone presentation. By peer review I give out the Jim Ranking Awards for the best. So chuffed to announce the winners: 🥇 Hannah Tran: The Quantified Self and Media Consumption Data Tracking 👁 bit.ly/43bBqCZ ⬇️
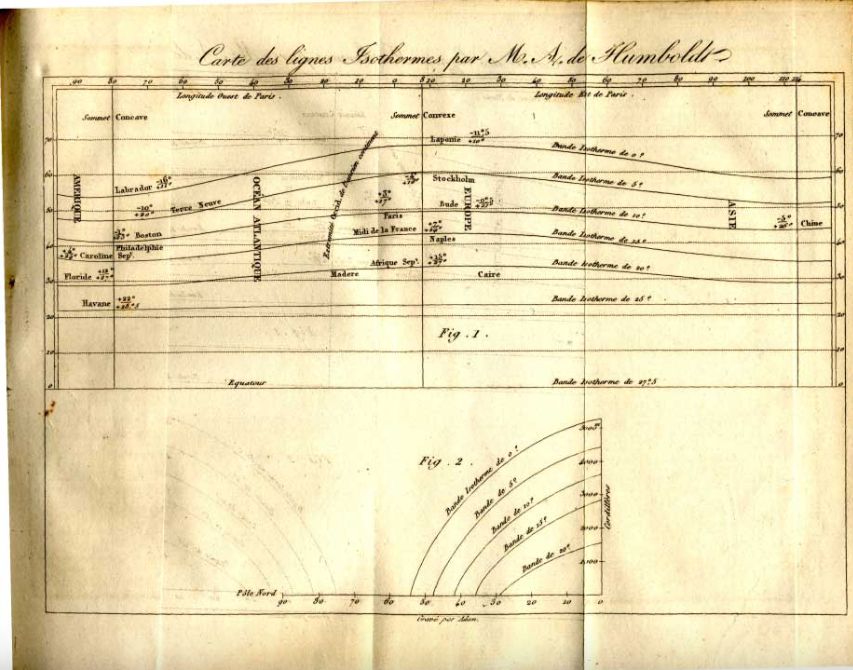
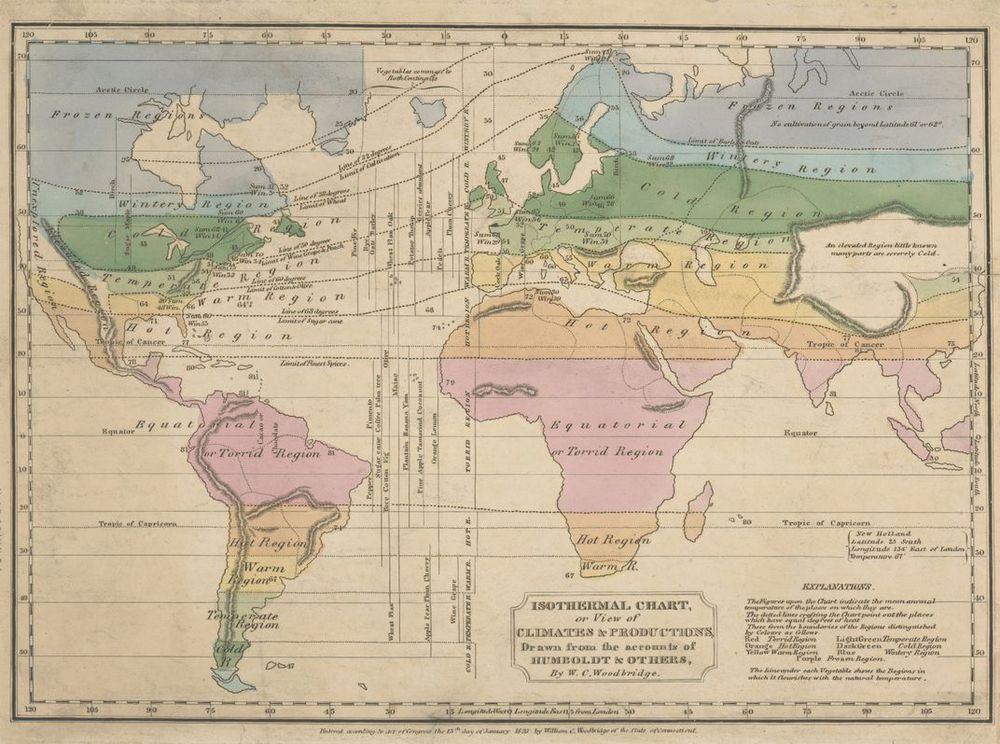
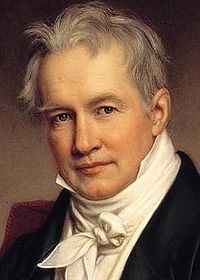
- #TodayinHistory #dataviz #Onthisday #OTD 📊 💀May 6, 1859 Alexander von Humboldt died in Berlin, Germany 🇩🇪 In 1817 he made the first graph of isotherms, showing mean temperature around the world by latitude and longitude.
- INDIVISIBLE -- getting people together for #PoliticalAction "Our democracy is under threat. But we will not yield to fascism. We will stand together and we'll fight back in defense of our rights, our communities, and our values. Join us." indivisible.org
- What a lovely way to convey the variation in methods across a range of separate studies.
- Yet one sensible use for standardized coefficients is in coefficient plots, particularly when there's a bunch of terms. Unstandardized coefs are in units of \Delta y / \Delta x_i which are more interpretable individually, but aren't comparable across x's
- It's also always a challenge to figure out what to do with NA and don't know in a situation like this
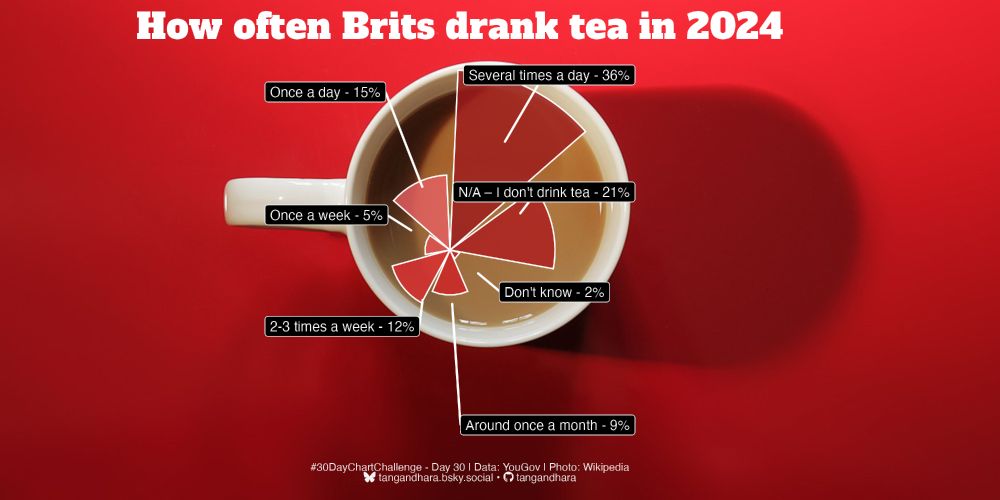
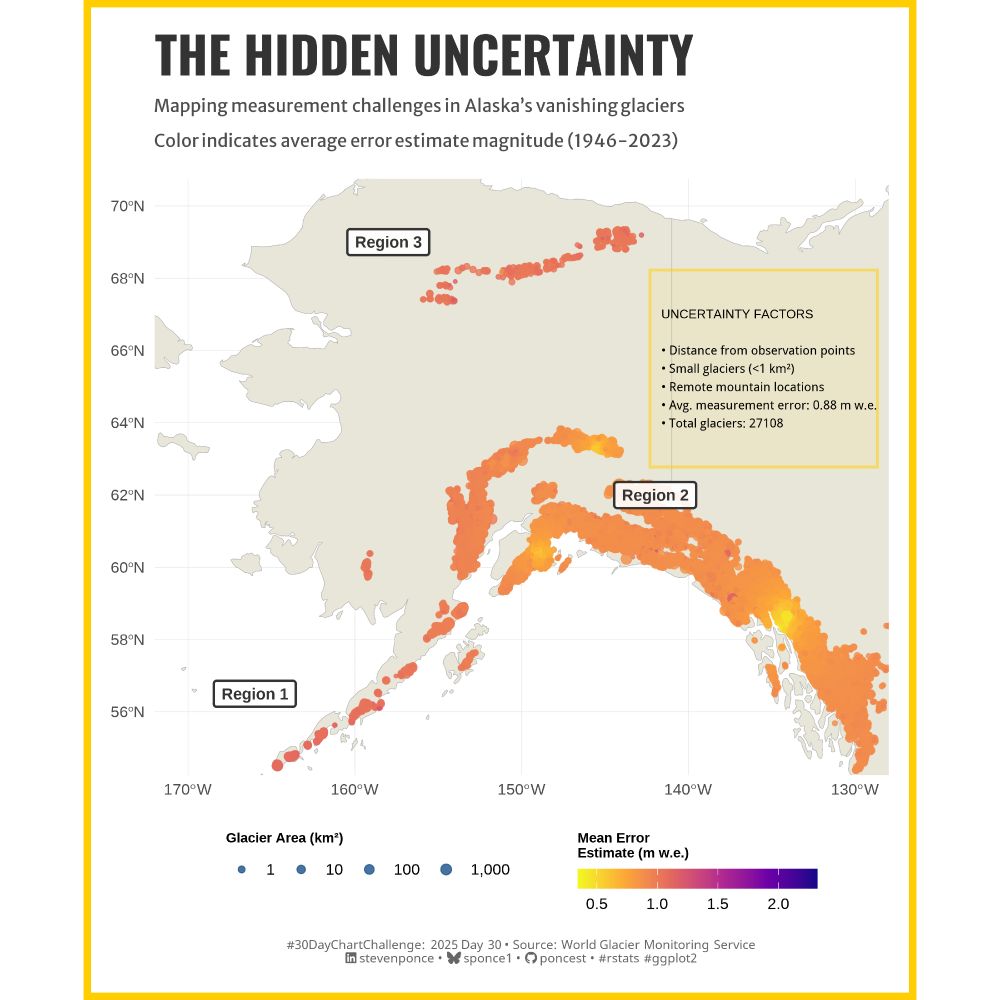
- #30DayChartChallenge - Day 30: National Geographic theme The final one! I had no idea what the style was so I Googled and found some interesting charts about tea from NatGeo which I used as inspiration. Not happy with the placement of the chart but I quite like the final result. #rstats #dataviz
- Better yet, just give your consulting clients a chance to get a good one. Note the subtle shaved corners on this one.
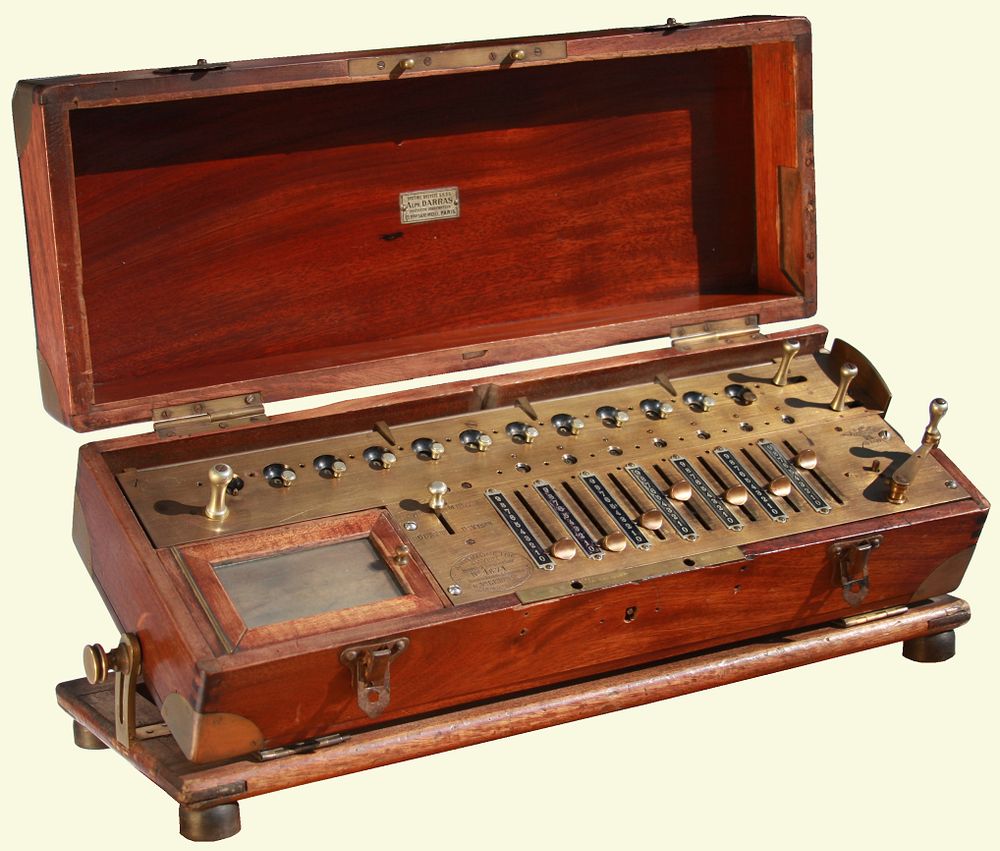
- #TodayinHistory #dataviz #OTD 📊 🎂May 5, 1785 Charles Xavier Thomas de Colmar born in Colmar, France 🇫🇷 1820: He invented the Arithmometer (Arithmomètre), the first digital mechanical calculator robust enough for office use. It was the first mass-produced mechanical calculator in the world
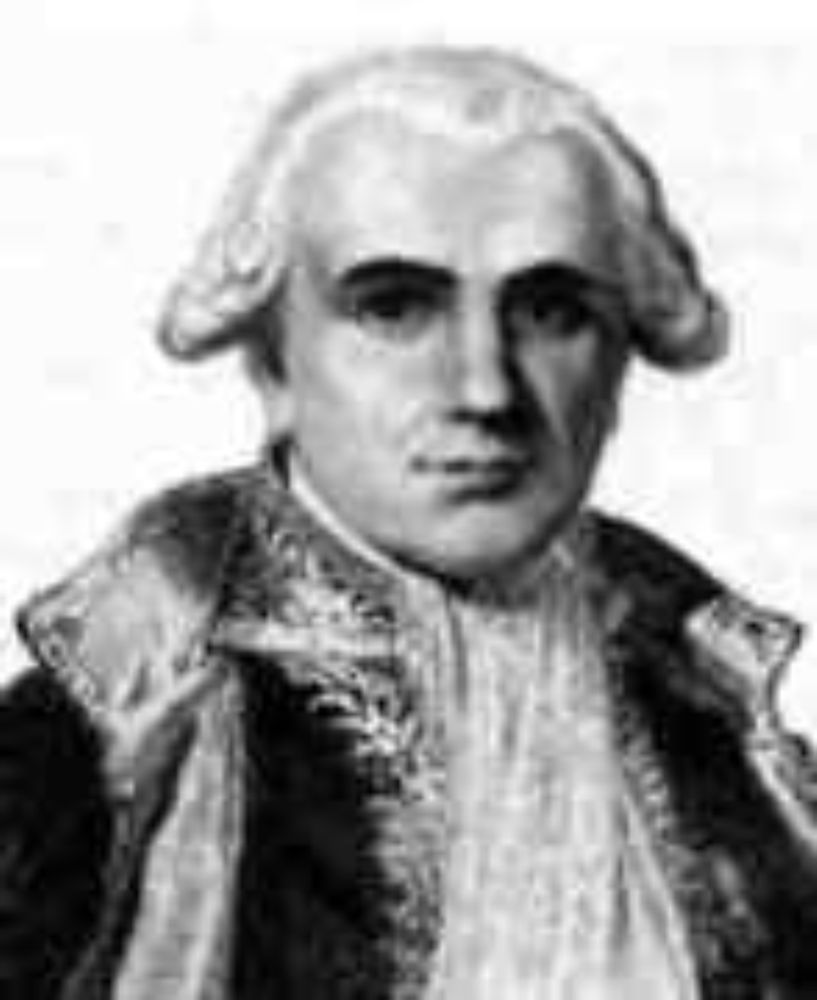
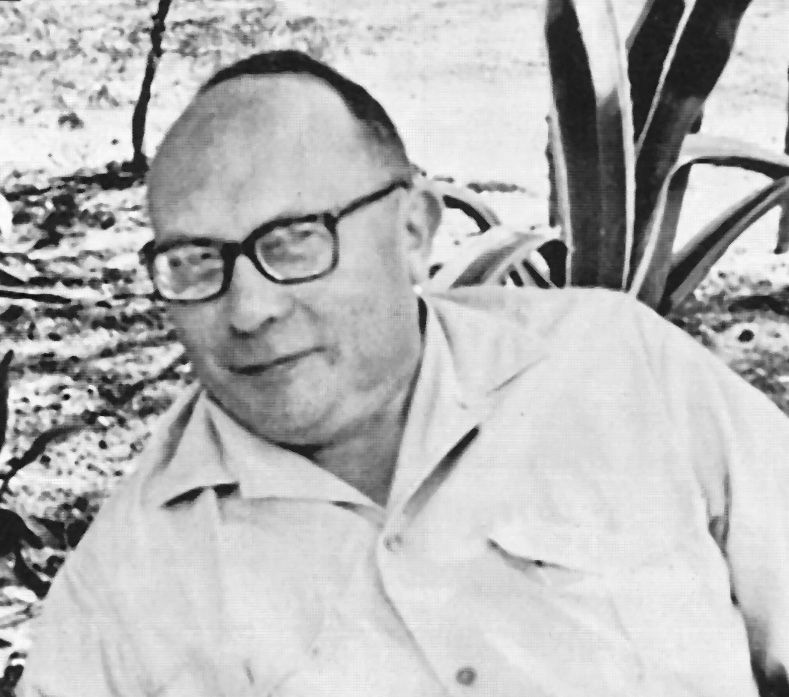
- 🎂May 5, 1936 Roger M. Goldwyn born in ?? 1971: Irregular polygon ("star plot'') to represent multivariate data, with Herman Friedman [Similar ideas go back a way, but not so much for multivariate data]
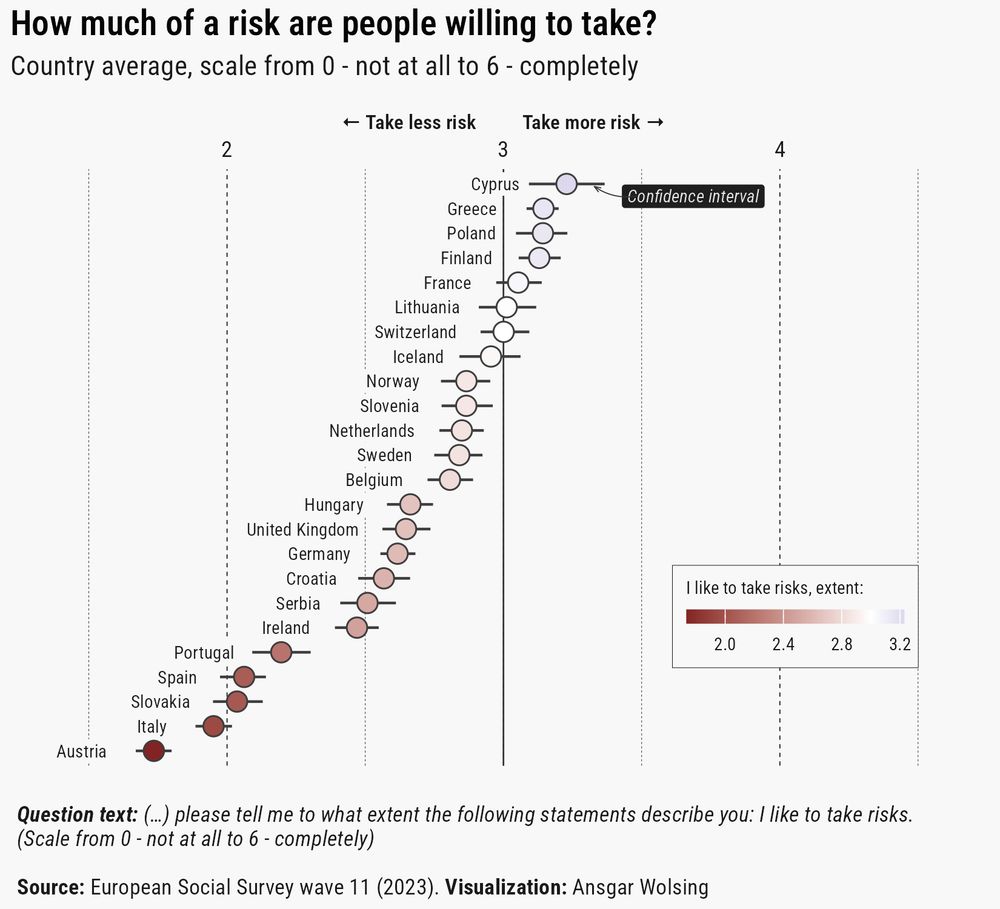
- Nice design! But what about making more risk more colorful rather than less?
- #TodayinHistory #dataviz #Onthisday #OTD 📊 💀May 3, 2010 Jacques Bertin died in Paris, France 🇫🇷 In 1967 his Semiology of Graphics became the first comprehensive theory of graphical symbols and modes of graphics representation --> Grammar of Graphics
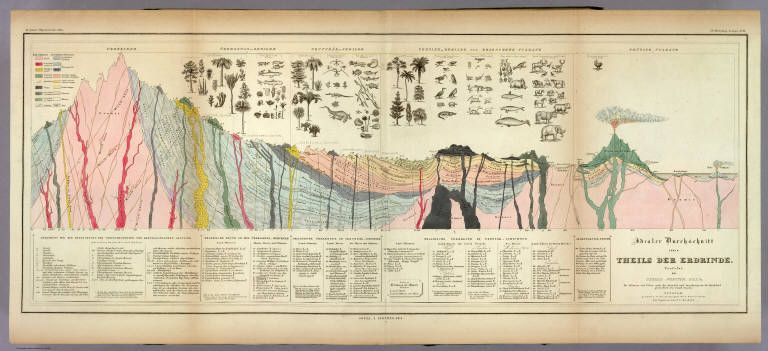
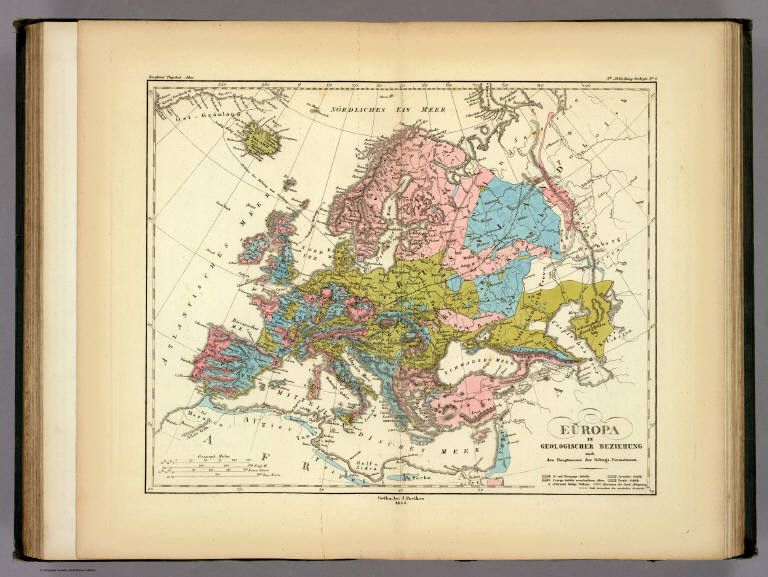
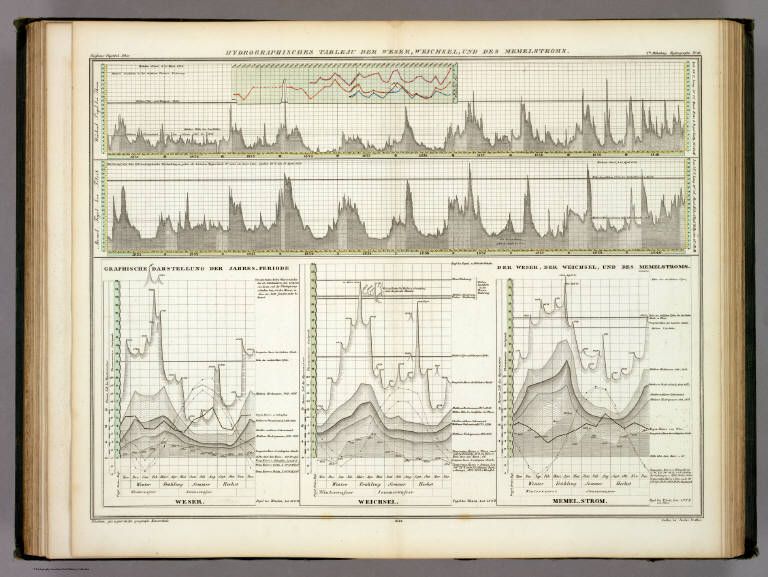
- #TodayinHistory #dataviz #Onthisday #OTD 📊 🎂May 3, 1797 Heinrich Berghaus born in Kleve, Germany 🇩🇪 His 1837 Physical Atlas of the distribution of plants, animals, climate, etc. was one of the most extensive and detailed thematic atlases. And gorgeous! 👁️🔗 www.davidrumsey.com/maps5386.html
- These interactive scrolly stories have been such a game changer in #data #journalism #ddj Also interesting is that forces ppl to think about how to unfold a story visually, which is less straightforward than in writing.
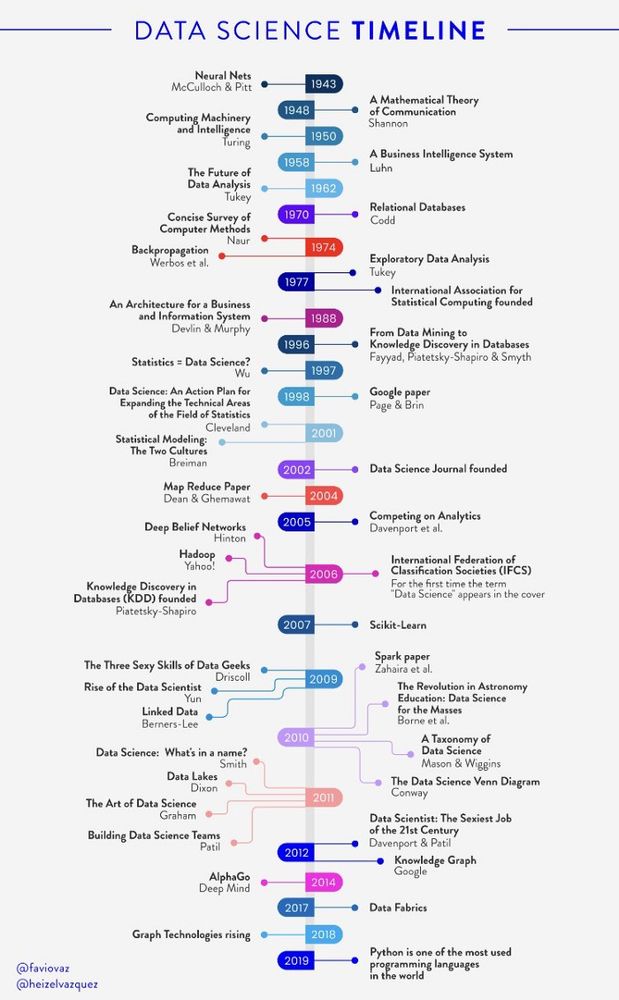
- 📊 #dataviz #stats When #statistics became expanded and re-branded to #datascience there's an opportunity to look at its #history in a #timeline. Here's one I found, source forgotten. What do people think about what's included and what not? What surprises you?
- And, that wiggliness can be measured as effective degrees of freedom makes it more comprehensible
- Wow! Sure wish I'd been there. What an event
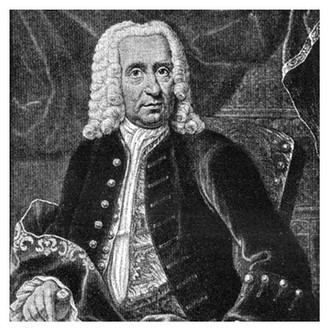
- #TodayinHistory #dataviz #Onthisday #OTD 📊 💀May 1, 1772 Gottfried Achenwall died in Göttingen, Germany 🇩🇪 1748: First use of the term "statistik,'' meaning numbers of the state. Some call him the 'father of statistics' bit.ly/4m2w3O8
- I always struggle with color scales where most of the data is confined to a narrow color range. Very fiddly work.
- 📊 2025 #30DayChartChallenge | day 30 | uncertainties | national geographics (theme) . 🔗: stevenponce.netlify.app/data_visuali... . #rstats | #r4ds | #dataviz | #ggplot2
- Looks more coherent in HSL space. Is that a face I see on the extreme left?
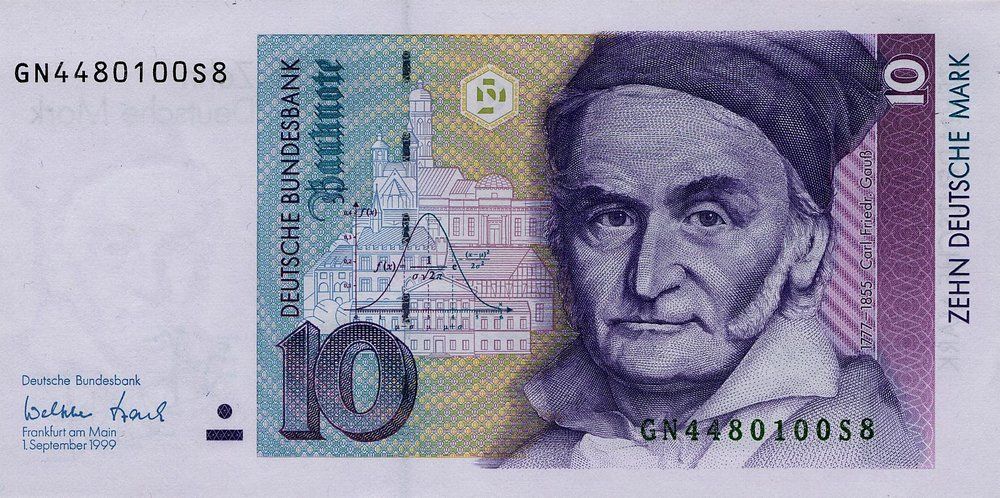
- #TodayinHistory #dataviz #OTD 📊 🎂Apr 30, 1777 Johann Carl Friedrich Gauss born in Braunschweig, Germany 🇩🇪 Discoverer ~1800 of least squares method (w/ Legndre) & connection with the normal (Gaussian) distribution; later extended to the Gauss-Markov theorem: LS gives best linear unbiased estimate.
- Enjoyed your work!
- What do you think of hanging the predicted bars from the observed ones, so the difference would appear around the 0 line?
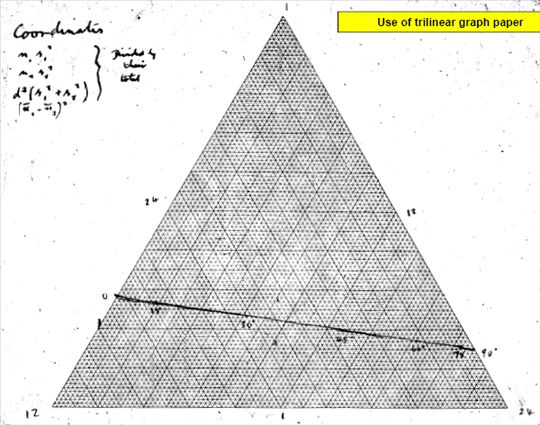
- #TodayinHistory #dataviz #Onthisday #OTD 📊 💀Apr 28, 1903 Josiah Willard Gibbs died in New Haven, Connecticut, USA 🇺🇸 1873: the first use of trilinear coordinates [graphs of (x,y,z) where x+y+z=constant] He used graphical methods applied to explain fundamental relations in thermodynamics.
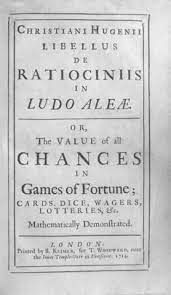
- #TodayinHistory #dataviz #Onthisday #OTD 📊 📅Apr 27, 1657 Christiaan Huygens published De Ratiociniis in Ludi Aleae; first printed work on probability theory & games of chance [Huygens:1657]
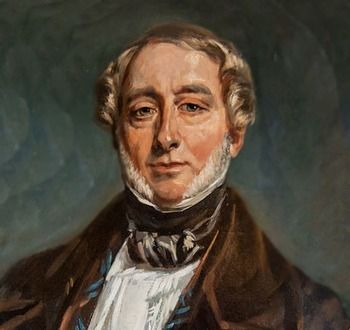
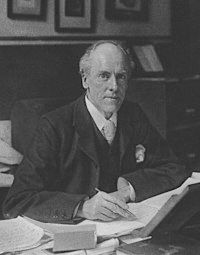
- #TodayinHistory #dataviz #Onthisday #OTD 📊 💀Apr 27, 1936 Karl Pearson died in Coldharbour, Surrey, England 🇬🇧 KP is credited with largely creating the discipline of mathematical statistics, chi-square test, correlation coef, Pearson distributions, ...