Search
- Are you looking to grow your communication and coaching skills? Sign up to become a mentor to give back to the #dataviz community and help uncover hidden talents within our members. www.datavisualizationsociety.org/mentorship/m...
- 🚦 Elevate your Excel skills! Learn to insert icons like ✅, ⚠️, and ❌ using IF statements and customize icon sets for dynamic data visuals. 📊 Make your spreadsheets more intuitive #ExcelTips #DataViz #ConditionalFormatting office-watch.com/2025/cool-co...
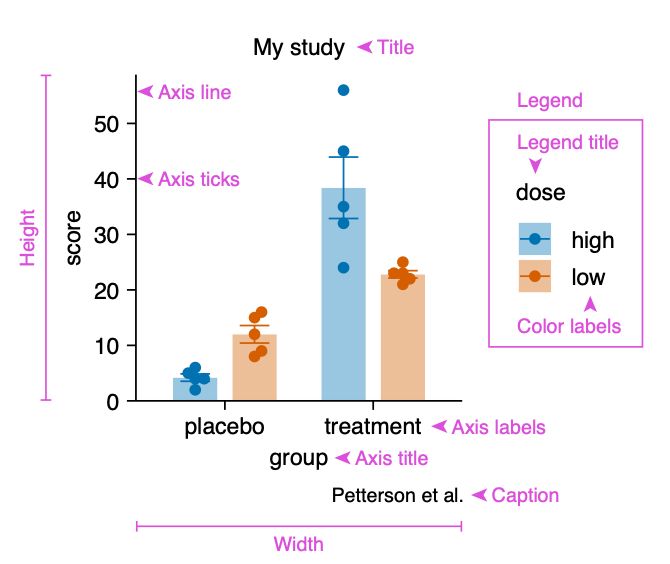
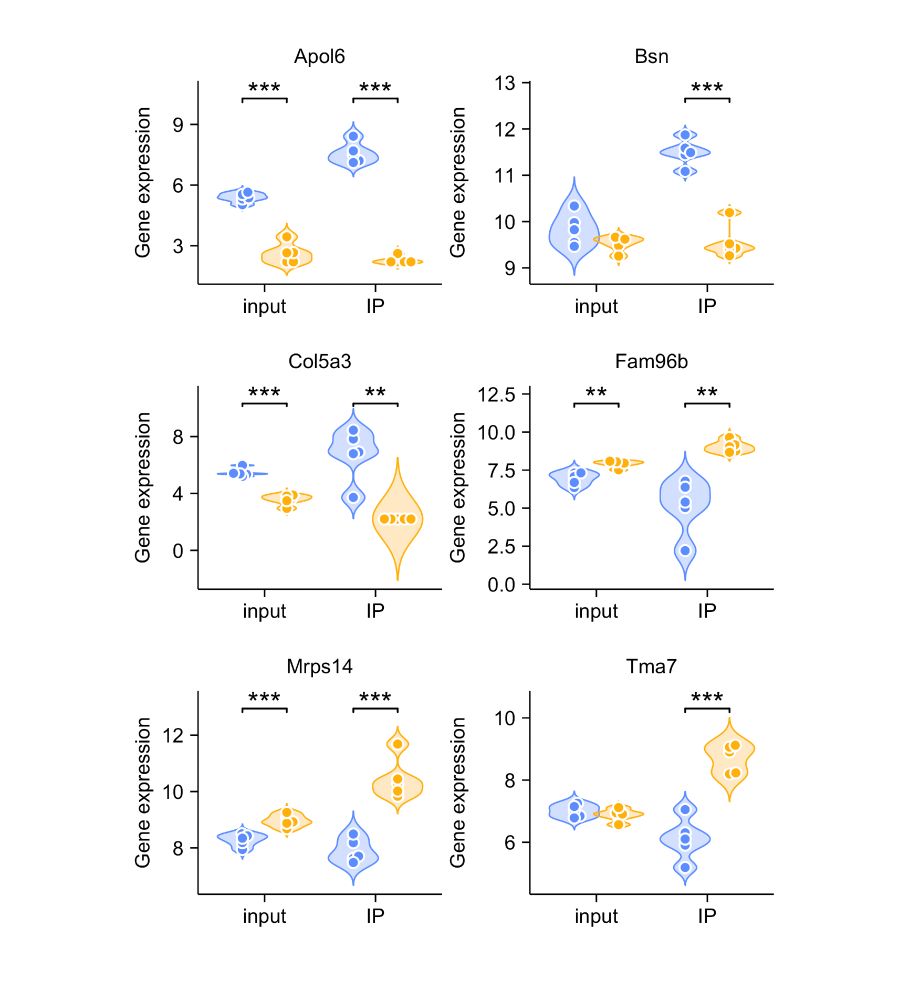
- This is the anatomy of #tidyplots 🩻 They come in 50 x 50 mm, but can be resized to your linking using `adjust_size()` 😉 #rstats #dataviz #phd
- It's #TidyTuesday y'all! Show us what you made on our Slack at https://dslc.io! #RStats #PyData #JuliaLang #RustLang #DataViz #DataScience #DataAnalytics #data #tidyverse #DataBS
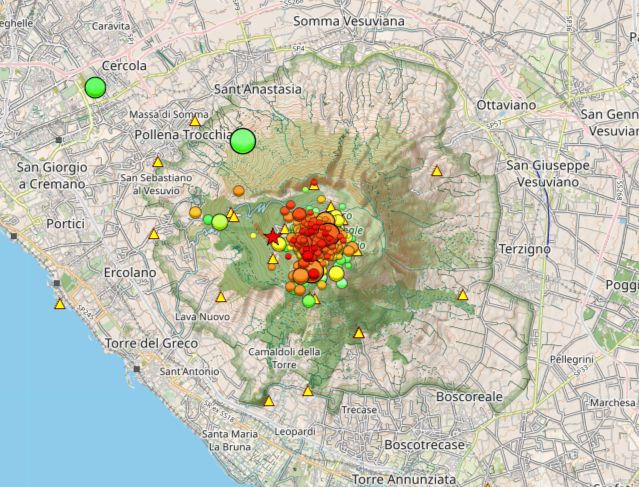
- Curator: @libbyheeren.bsky.social @dslc.io welcomes you to week 19 of #TidyTuesday! We're exploring Seismic Events at Mount Vesuvius! 📂 tidytues.day/2025/2025-05-13 🗞️ https://www.ingv.it/somma-vesuvio #RStats #PyData #JuliaLang #DataViz #tidyverse #r4ds
- Big update to my book #r4np 👉 r4np.com Major chapter revisions done for upcoming CRC Press release. Just a few tweaks left. Drafting next book already - less stats, more #DataViz 👀📊 #RStats #DataScience #stats
- How does your state rank in voter turnout? Check the chart to find out. Here's three interactive visualizations I made showing how each state performed in the 2024 Election compared with 2020. California and Hawaii surprised me! 🔗 sarahbellmaps.com/2025/2024-vo... #dataviz #datavisualization
- Excited to launch "ggplot2 [un]charted" with @yan-holtz.bsky.social! 🎉 An online course to master #ggplot2 with exercises, quizzes, and modules—and hands-on code running in your browser! Still WIP—sign up now for a limited discount: 👉 www.ggplot2-uncharted.com #rstats #DataViz #DataVisualization
- Curator: @libbyheeren.bsky.social @dslc.io welcomes you to week 19 of #TidyTuesday! We're exploring Seismic Events at Mount Vesuvius! 📂 tidytues.day/2025/2025-05-13 🗞️ https://www.ingv.it/somma-vesuvio #RStats #PyData #JuliaLang #DataViz #tidyverse #r4ds
- Haaland or Bug? - An update for the 2023-2024 season - fulltimesportsfan.wordpress.com/2025/05/11/h... A #football #DataViz although I acknowledge some of the weirder shapes are because of how Excel extrapolates from the data.
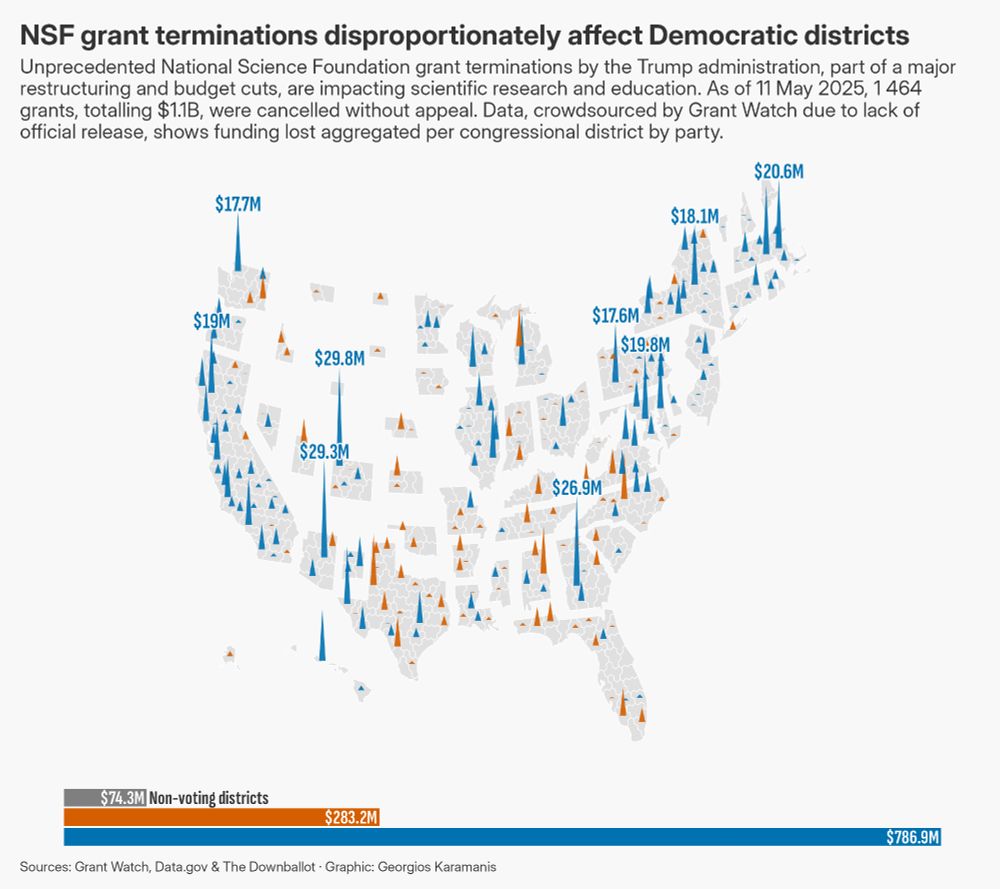
- NSF grant cuts for this week's #TidyTuesday Code: github.com/gkaramanis/t... Map by @donnermaps.bsky.social of @the-downballot.com at the-db.co/maps #RStats #dataviz
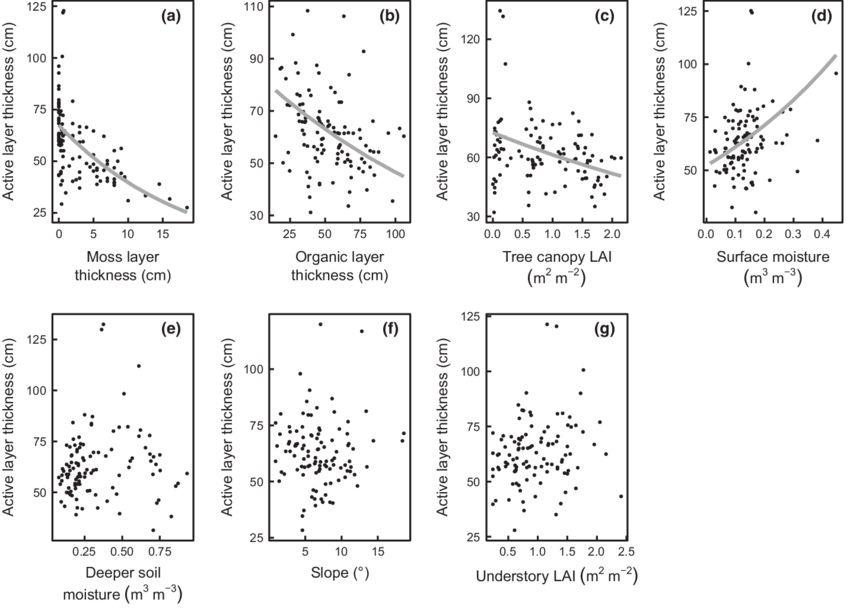
- #TodayinHistory #dataviz #Onthisday #OTD 📊 🎂May 10, 1899 Mordecai J. B. Ezekial born in Richmond, Virginia, USA 🇺🇸 In 1924, he developed the essential idea behind what are now called partial residual plots -- showing the net relation of a predictor controlling for others.
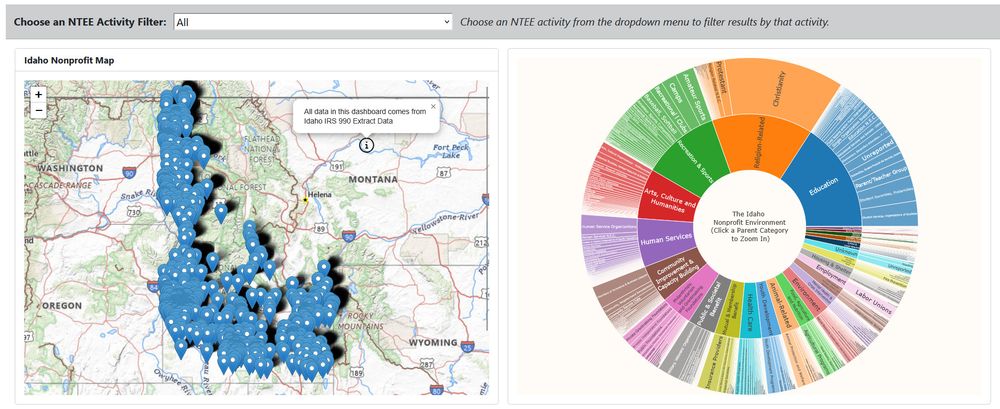
- As part of learning Javascript for web-based data visualization, I just finished building a dashboard from IRS data on Idaho's nonprofit sector. Check it out to learn how many nonprofits Idaho has, where they are, and what they do! lantzmcginnisbrown.com/posts/2025-0... #dataviz #nonprofitsky
- Apply as a mentor today for our DVS Mentorship Program and provide valuable 1-on-1 guidance to the #dataviz practitioners of tomorrow. 📋Apply here: www.datavisualizationsociety.org/mentorship/m... Full Mentorship details: www.datavisualizationsociety.org/mentorship
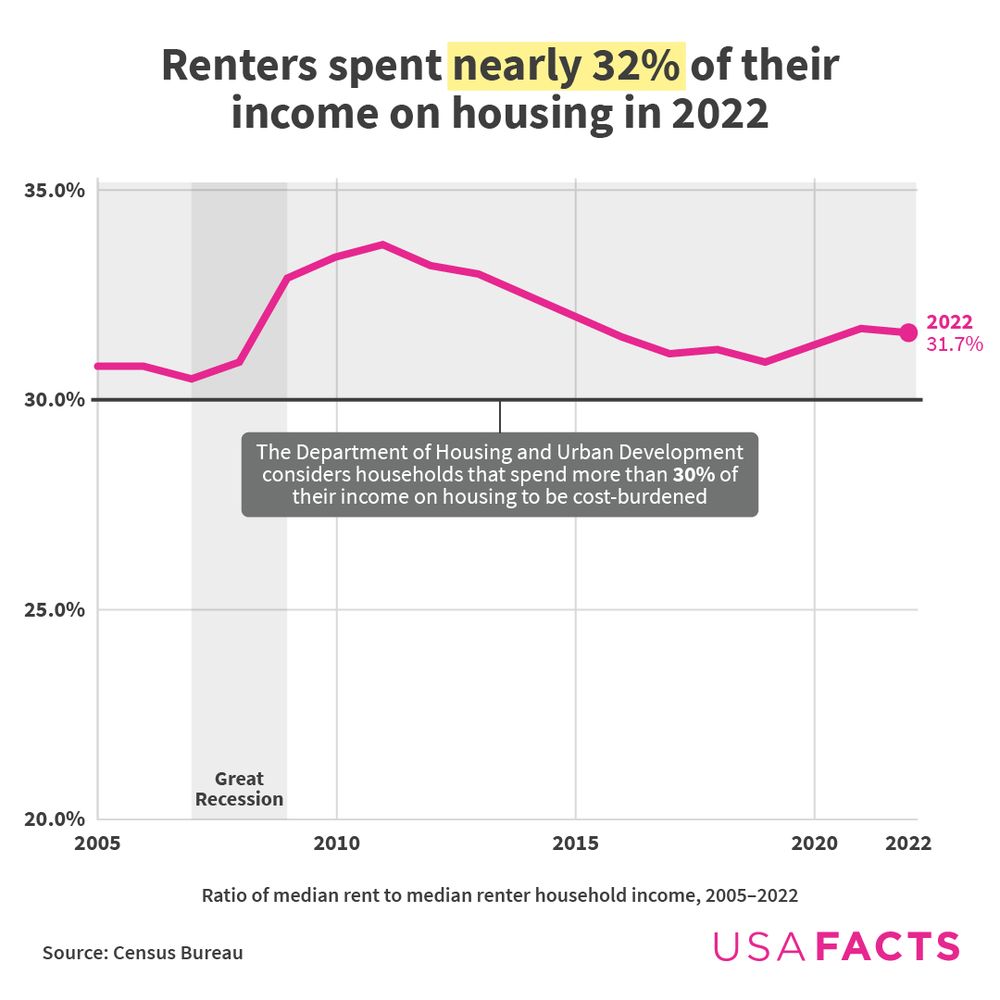
- So how much are households actually spending on rent? In 2022, median #rent was 31.7% of median income — crossing the 30% threshold the Department of Housing and Urban Development uses to define “cost-burdened” households. #Dataviz #AffordableHousing
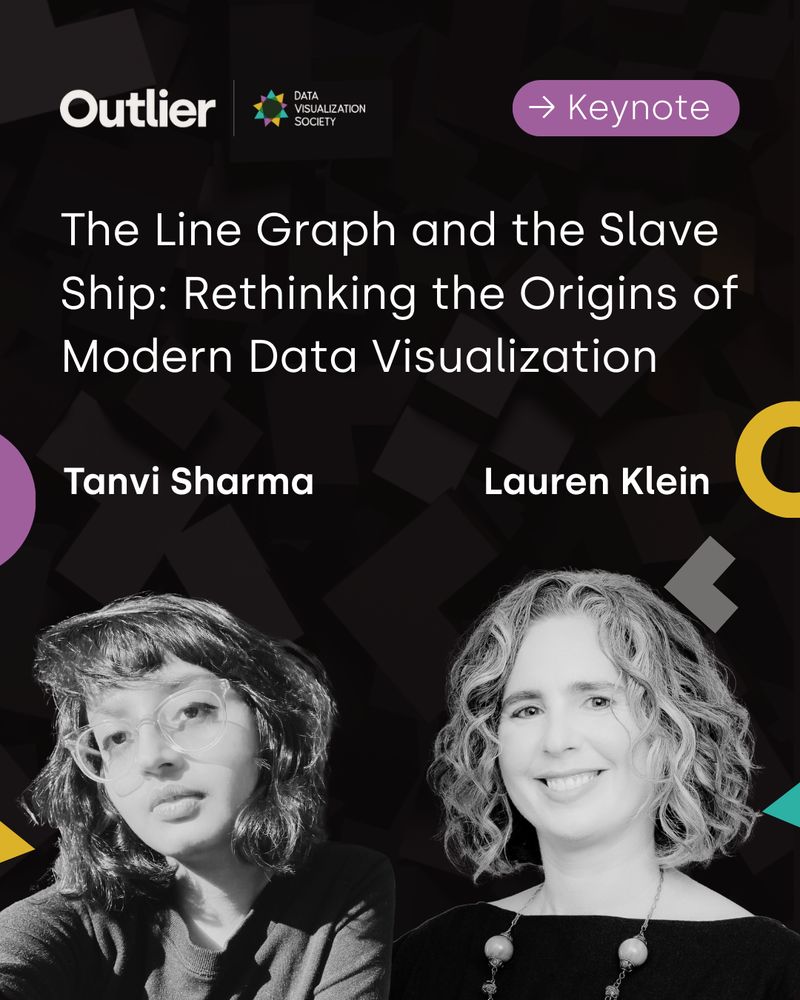
- Meet Lauren Klein & Tanvi Sharma from Emory University. Lauren and Tanvi will deliver the opening Keynote at #Outlier2025: “The Line Graph and the Slave Ship: Rethinking the Origins of Modern Data Visualization” Explore the agenda: www.accelevents.com/e/outlier-20... #dataviz #datavisualization
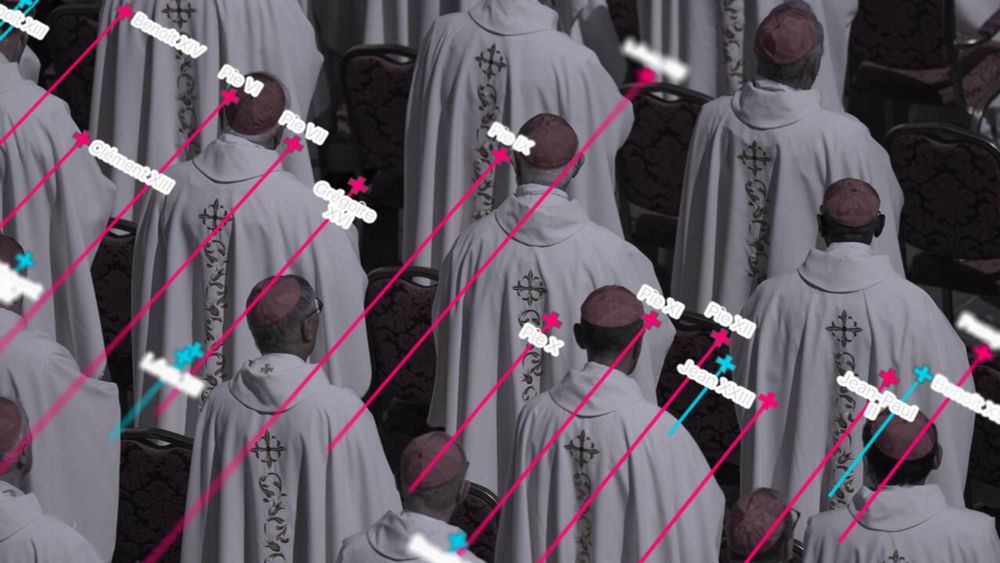
- [Ça vaut le coup 👁️] Très contente de voir ce long form, réalisé lors de mon passage chez Bronx pour La Croix, sortir en ce premier jour de Conclave 👇 www.la-croix.com/Religion/inf... #infographie #dataviz #ddj
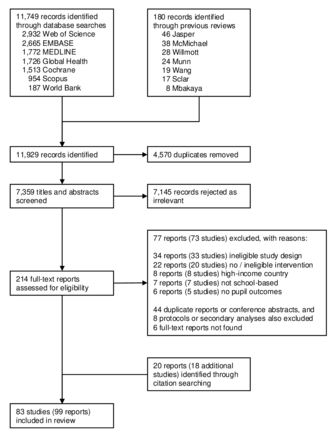
- 👋 Hi Bluesky! Our scoping review of water, sanitation and hygiene in schools is now published in BMJ Global Health Read on if you’re interested in 🧼 #WASH 🤸♀️ #AdolescentHealth 🔍 #EvidenceSynthesis 🎨 #dataviz ?? @lshtm-ehg.bsky.social gh.bmj.com/content/10/5...
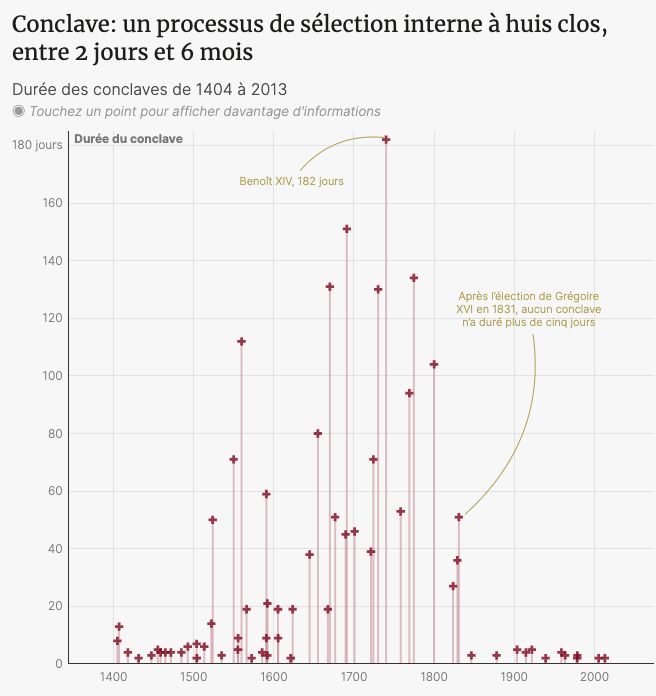
- Depuis 1404, le processus de promotion interne du Vatican a pris entre 2 jours et 6 mois #conclave Il faut remonter à près de deux siècles pour trouver un conclave ayant duré plus d’une semaine 👇🏼 www.letemps.ch/data/en-grap... #pape @letemps.ch #dataviz
- #Eurovis 2025 is on in Luxembourg this year and is being hosted by my research group VISINT from LIST. Come and join us for the conference. eurovis2025.lu #dataviz #dataviz #conferences #hci
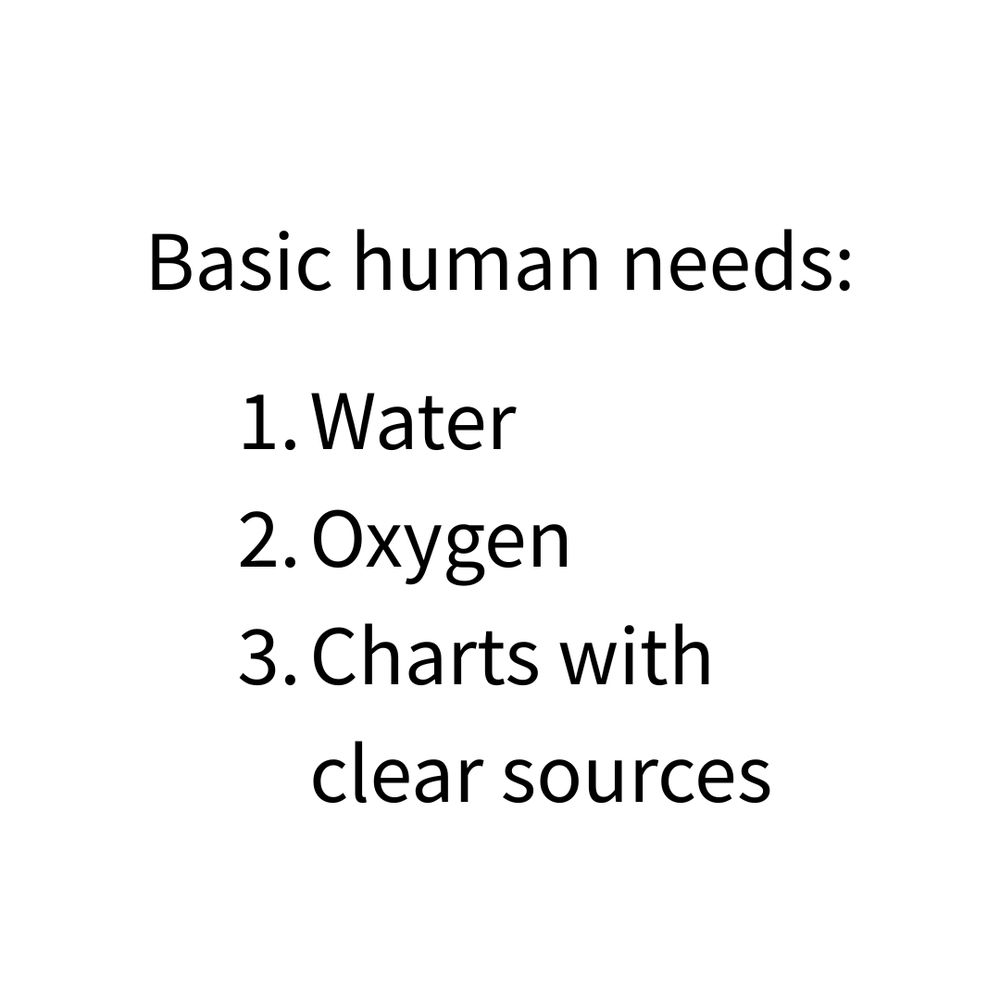
- Here in Portugal #dataviz is ignored most of the time. Or it gets a bad rep because fringe parties and nutcases in general use charts.
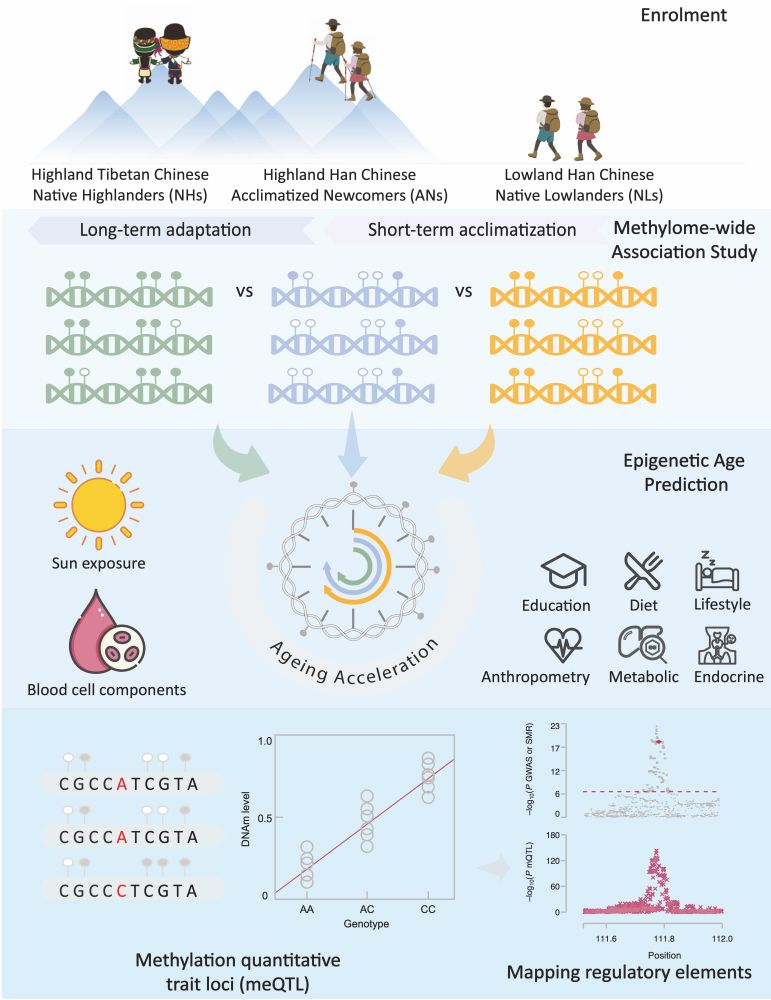
- #DataViz on #DNA methylation and ageing patterns in native Tibetans! 🧬🧪 #science 🏺 #anthropology #biology
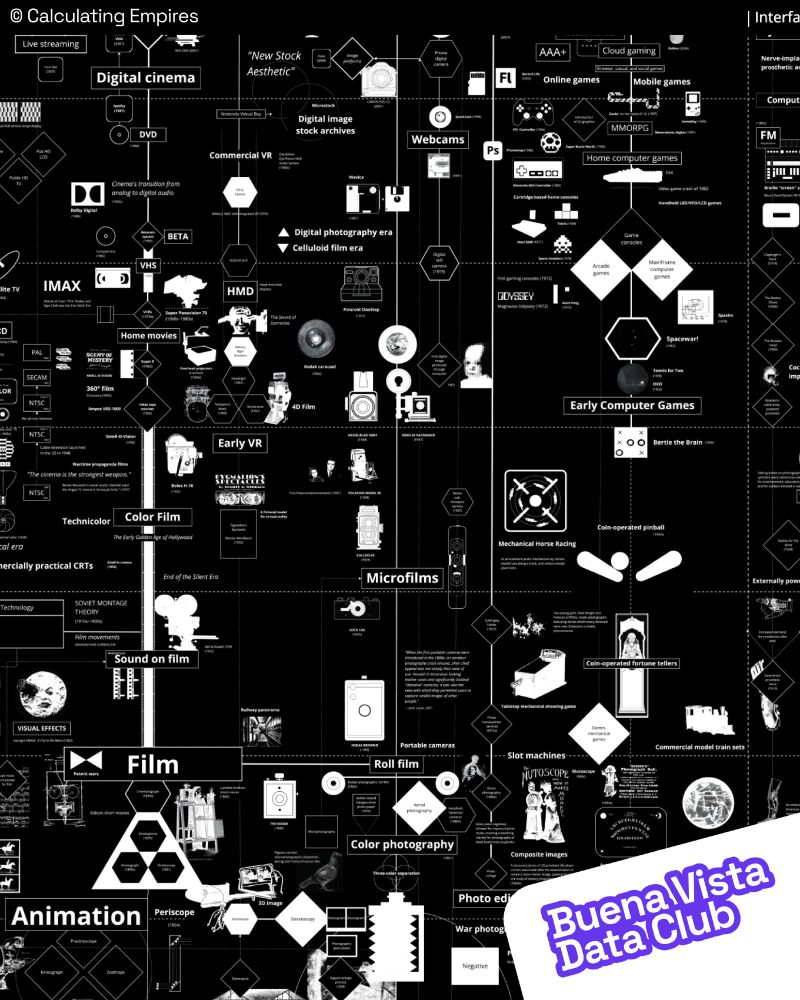
- Calculating Empires est une visualisation de recherche à grande échelle qui s’articule autour de quatre thèmes : la communication, le calcul, la classification et le contrôle. #data #dataviz #datavisualisation #ia
- My friend sent me a podcast where they mentioned my Tommy Westphall Universe #dataviz. I think I'll have to accept the fact that this is what I'm most known for at this point. (If being a top ten most-read article on Nightingale wasn't already an indicator) 📊
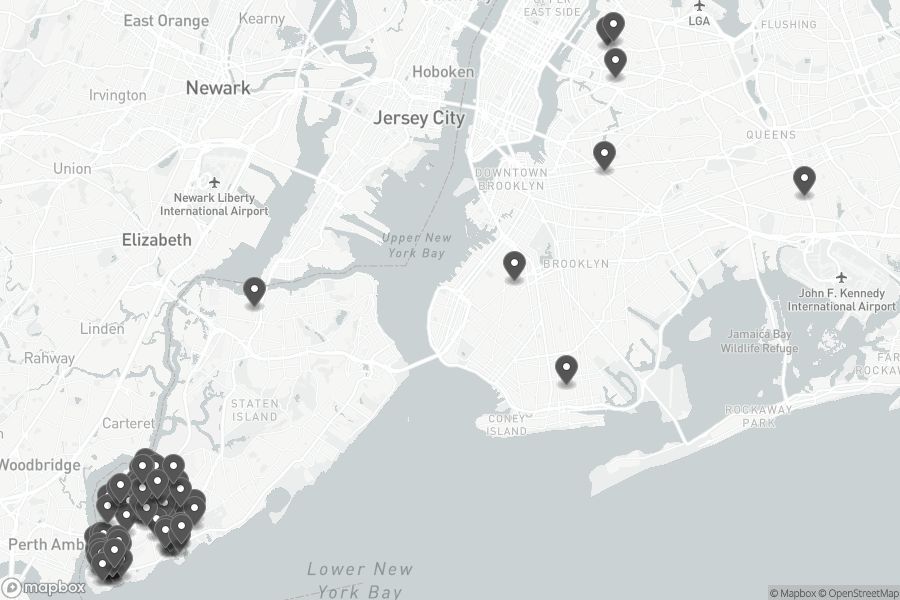
- 📊 🧶 When was the last time you learned of a new chart? Do you know when to use parallel coordinates, hammock, or Sankey plots? Join #dataviz fans & Professor/author Matthias Schonlau in NYC for the May 19 meetup on mixed categorical/numeric data @datadoghq.com! RSVP: www.meetup.com/datavisualiz...


