
Zack Labe
Climate Scientist (Atmospheric) | PhD | Views, thoughts, and opinions expressed here are only my own
Passionate about improving science communication through data-driven stories | Princeton, NJ | zacklabe.com | buymeacoffee.com/zacklabe
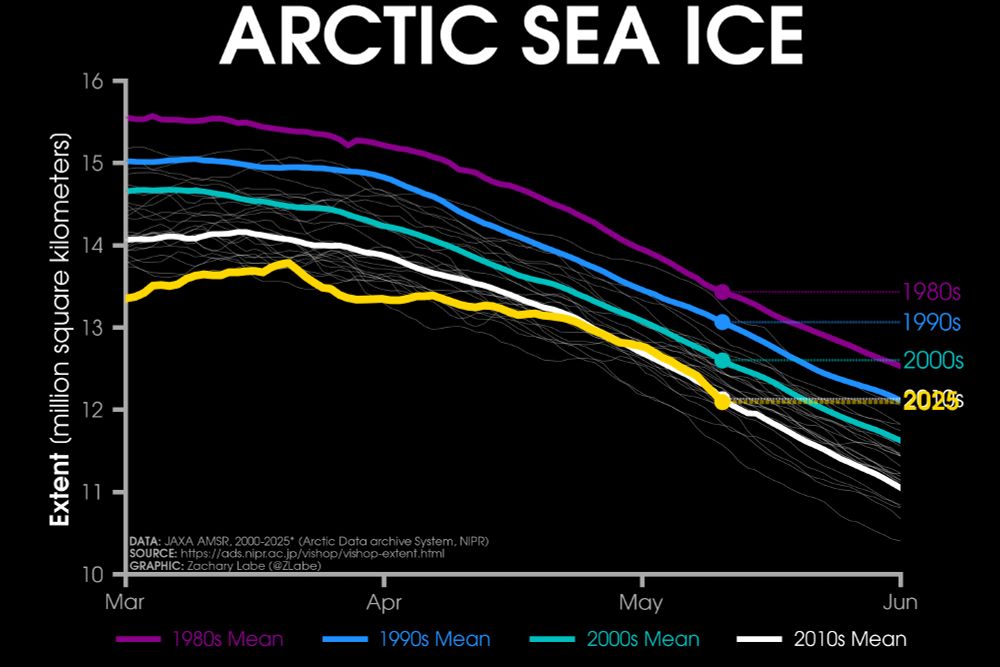
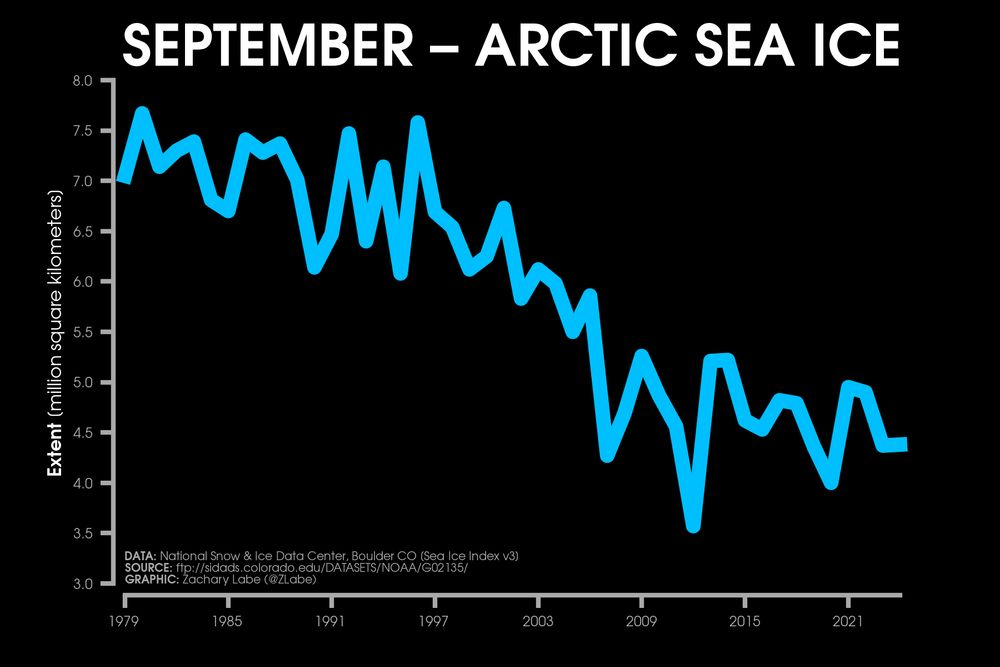
- Monday ice update - #Arctic sea ice extent is currently the 7th lowest on record (JAXA data) • about 40,000 km² below the 2010s mean • about 510,000 km² below the 2000s mean • about 970,000 km² below the 1990s mean • about 1,340,000 km² below the 1980s mean Plots: zacklabe.com/arctic-sea-i... ❄️🥼🌊🛠️
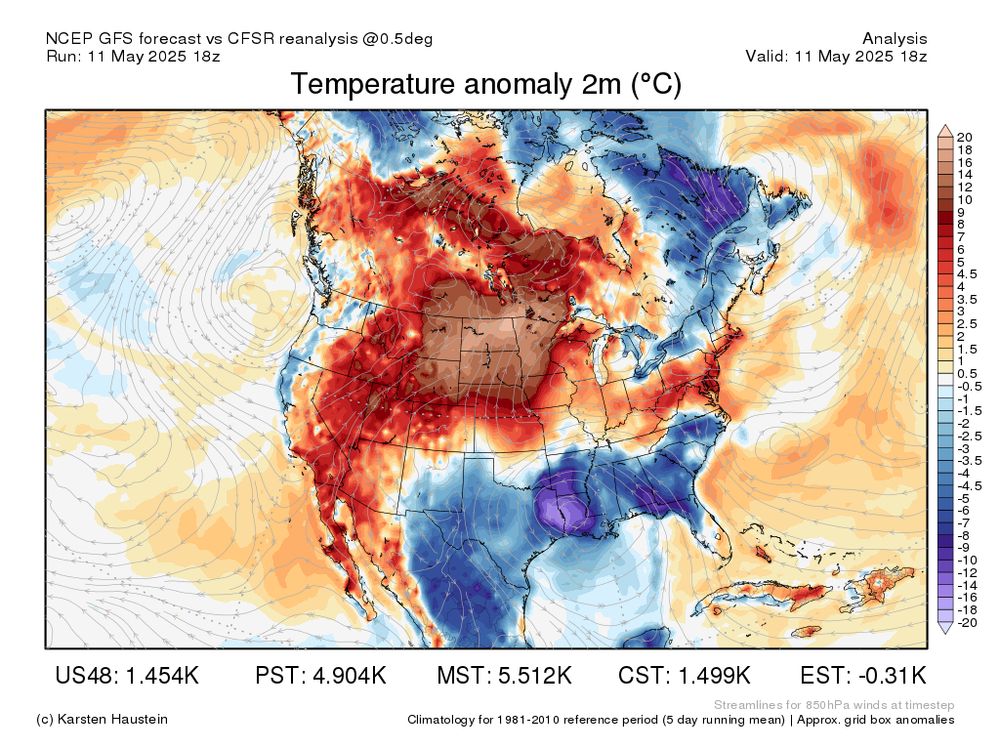
- Up to 100°F today near the US-Canada border... in early/mid-May... not great!! Graphic from www.karstenhaustein.com/climate
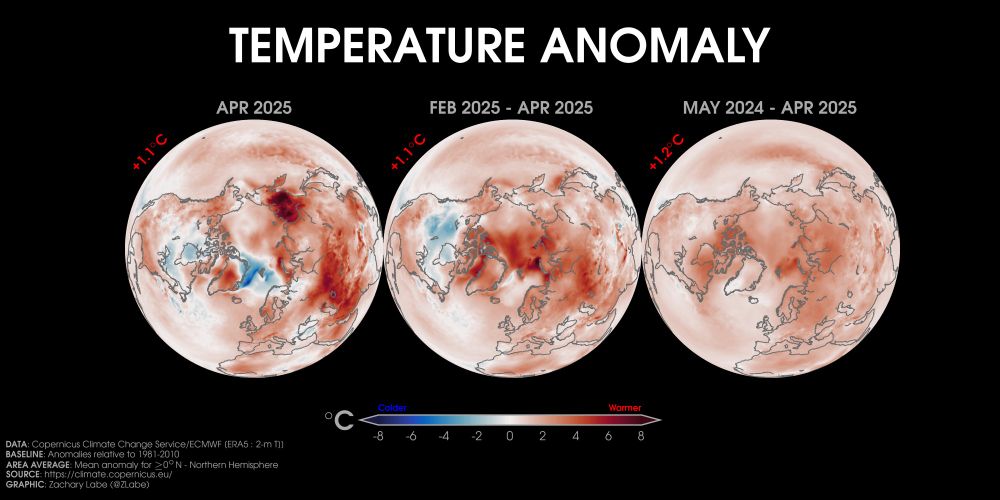
- Temperature anomalies over the last month (left), 3 months (center), and 12 months (right) in the Northern Hemisphere... Data from doi.org/10.24381/cds...
- Watch what happens. Changes in the age of #Arctic sea ice during springtime... Note that younger sea ice is usually thinner and more vulnerable to melting. Data from doi.org/10.5067/UTAV...
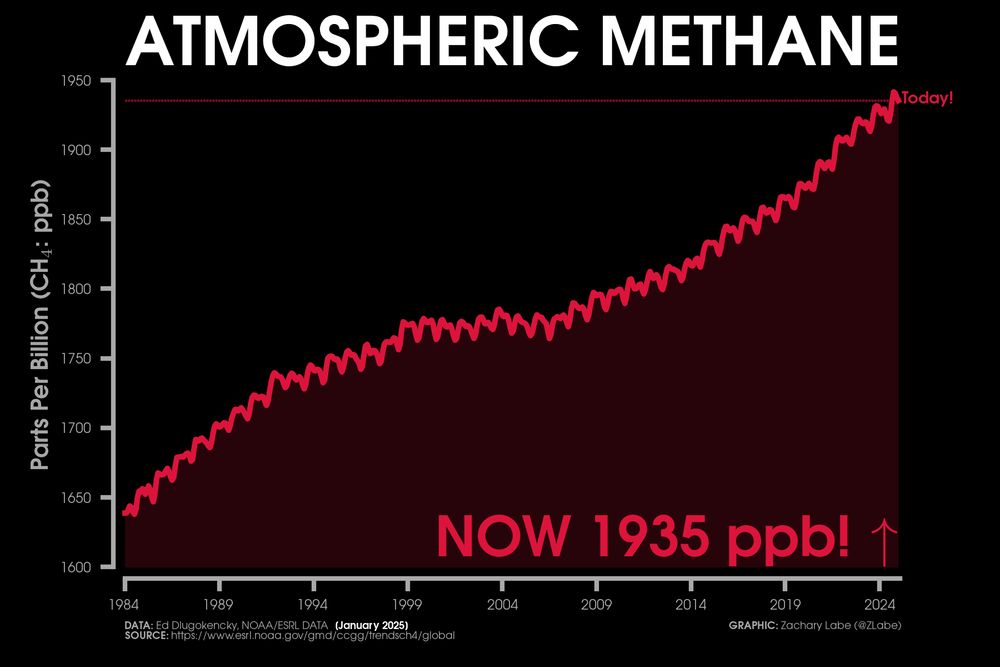
- Methane (CH₄) is a potent greenhouse gas. Here are the newest monthly observations (upper right corner)... 📈 January 2025 - 1935 ppb January 2024 - 1928 ppb Data from @noaa.gov: gml.noaa.gov/ccgg/trends_...
- Now weeks after we were retroactively fired, they continue to send us all condescending and cruel emails. It's so upsetting and exhausting.
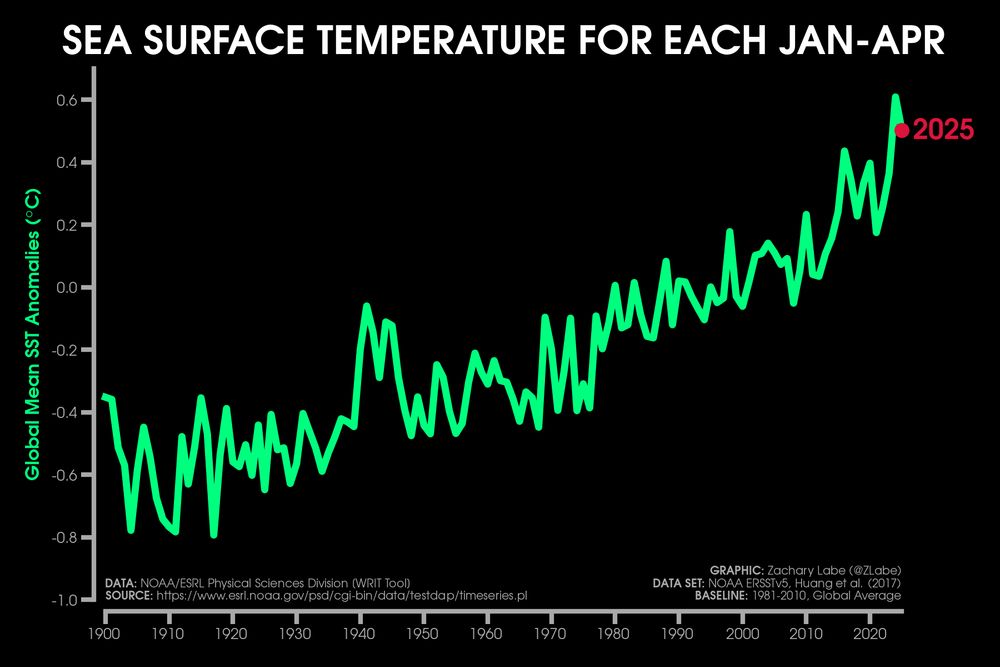
- Global mean sea surface temperature anomalies (departure from average) so far this year ➡️ still the 2nd highest on record Data from NOAA ERSSTv5 averaged over January to April.
- For decades, this iconic graph has provided clear observational evidence of one of the key indicators of global climate change - Arctic sea ice loss. It’s from the NSIDC "Sea Ice Index" Now, support of this crucial data is at risk. A visual lens to our changing poles (zacklabe.com/arctic-sea-i...).