Search
- Manhattan demographics mapped as a 3D, rotatable layer stack. There are endless possibilities for creative visualization with R and the {mapgl} package. Run the code: gist.github.com/walkerke/b7f... Then read the mapgl docs: walker-data.com/mapgl #rstats #gis #datavisualization
- I'm proud that I can talk about my new project :3 I'm working on the first piece of software for the raspberry pi I am developing. Check it out if you want >^w^< github.com/thefool309/p... #CyberSecurity #SoftwareDevelopment #Typescript #Docker #Node.js #vue #Vite #nmap #DataVisualization
- How does your state rank in voter turnout? Check the chart to find out. Here's three interactive visualizations I made showing how each state performed in the 2024 Election compared with 2020. California and Hawaii surprised me! 🔗 sarahbellmaps.com/2025/2024-vo... #dataviz #datavisualization
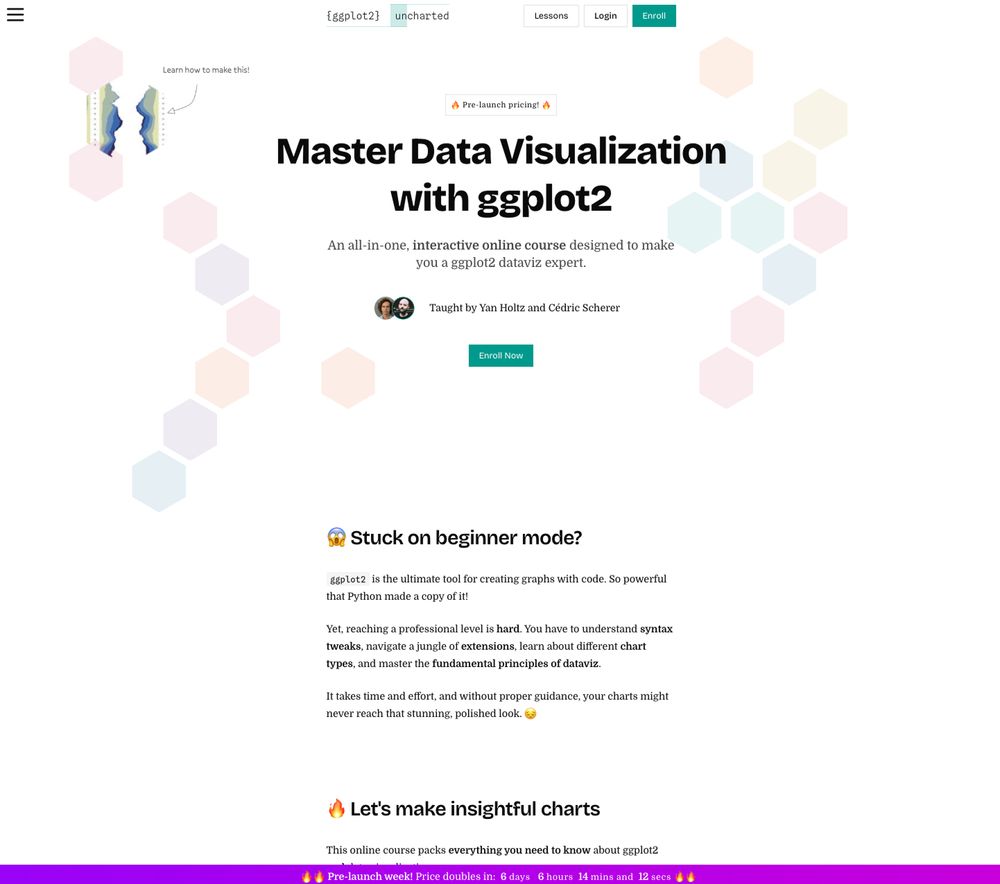
- Excited to launch "ggplot2 [un]charted" with @yan-holtz.bsky.social! 🎉 An online course to master #ggplot2 with exercises, quizzes, and modules—and hands-on code running in your browser! Still WIP—sign up now for a limited discount: 👉 www.ggplot2-uncharted.com #rstats #DataViz #DataVisualization
- Boost Your Sales Pipeline with #Dynamics365 Kanban Visualization buff.ly/3sykBVN #KanbanBoard #DataVisualization #KanbanView #DynamicsCRM #KanbanVisualization #kanbandynamics365
- I built a custom feed for data science enthusiasts. #datascience #python #rstats #rstudios #computationalscience #jupyter #datavisualization #excel #coding #charts #statistics #dataanalysis
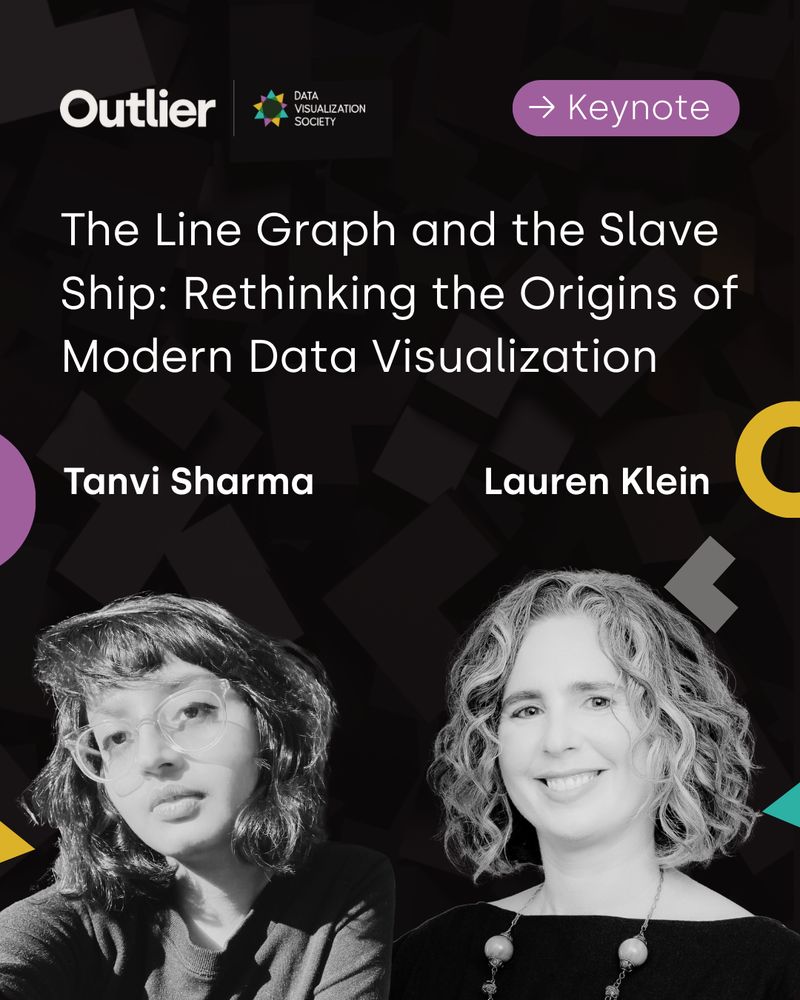
- Meet Lauren Klein & Tanvi Sharma from Emory University. Lauren and Tanvi will deliver the opening Keynote at #Outlier2025: “The Line Graph and the Slave Ship: Rethinking the Origins of Modern Data Visualization” Explore the agenda: www.accelevents.com/e/outlier-20... #dataviz #datavisualization
- Boost your data visualization skills with drill-down charts in Blazor! 📊 Discover how to implement interactive charts for deeper insights and make data-driven decisions with ease. #Blazor #DataVisualization
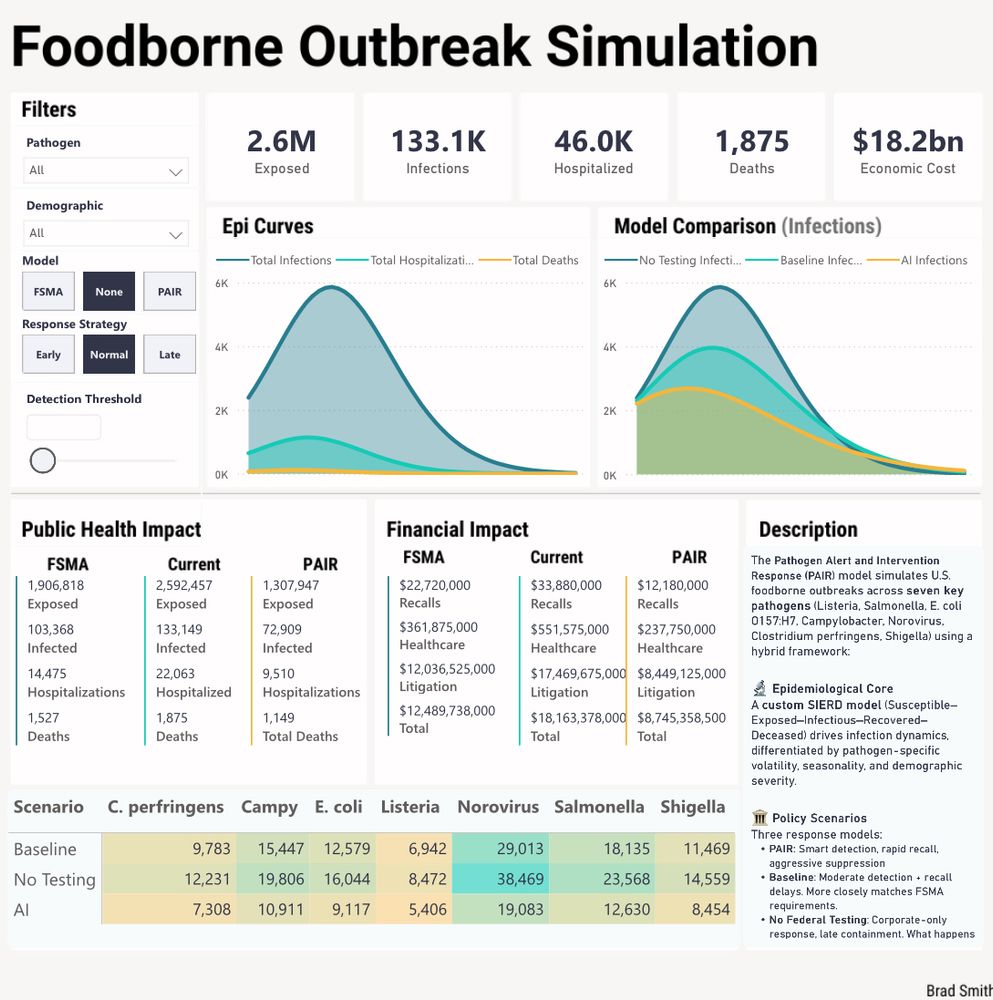
- Damnit… I’m gonna have to write a whole research paper and get this peer reviewed, aren’t I? I spent a decade in dairy so I was only trying to figure out how bad the FDA’s recent decision to suspend Grade A milk could get and it’s… concerning. #PublicHealth #EconSky #DataVisualization #EpiSky
- 📊✨ You'll be able to delve deep into your data and easily identify any issues you might have. 🚀🔍 #MangoAPI #DataVisualization #BItool #UnleashThePower #manycaps
- If you missed charting legend Jon Peltier's presentation at last week's Vancouver #PowerBI and Modern #Excel meet-up, the recording is now available: youtu.be/FiYEtyLtQCs We had a great time diving into how to use Lambda #DynamicArrays to create Statistical Process Control charts. #DataVisualization
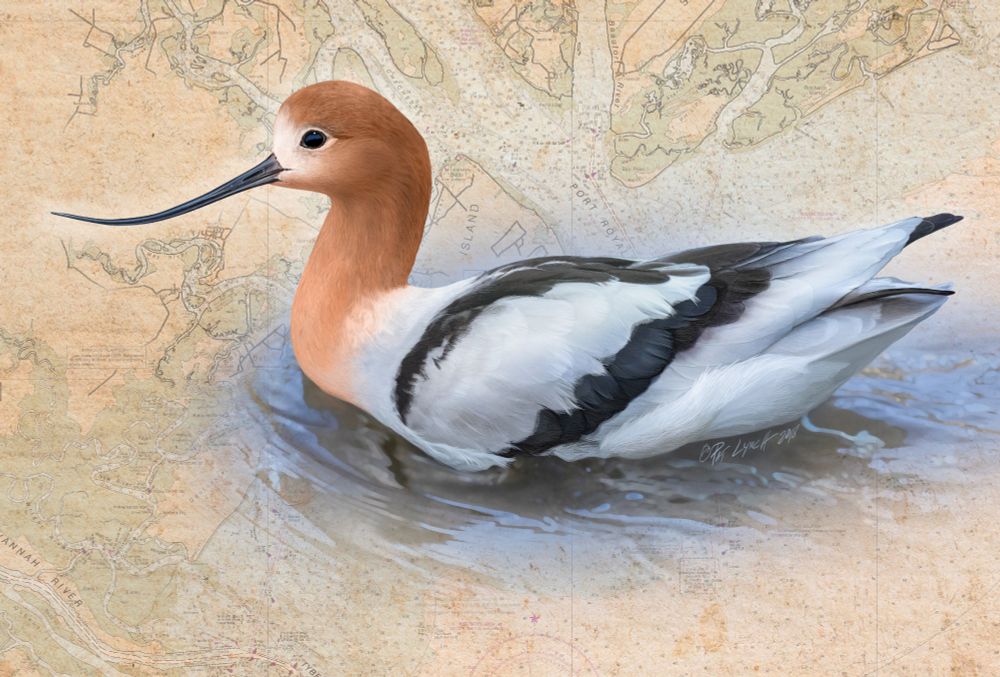
- Savannah River Avocet. 🧪🌿🌎 #sciart #scicomm #diagrams #infographics #Graphics #VisualJournalism #DataVisualization #Infographics #VisualStorytelling #InformationDesign #VisualCommunication #avocet #birds #birdart
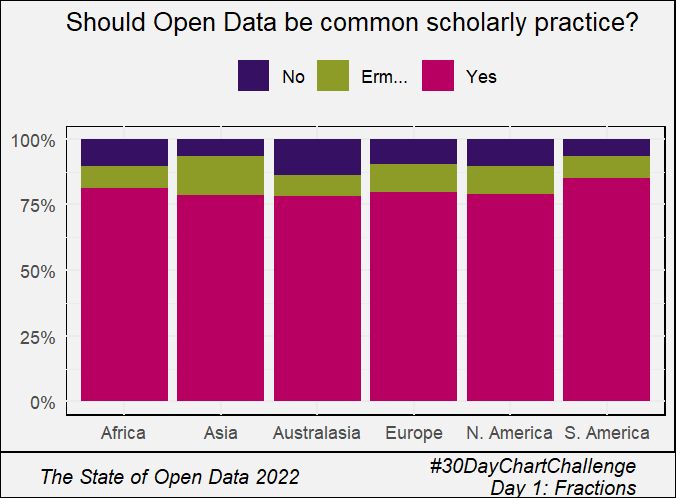
- Most researchers think that sharing data openly should be a common scholarly practice. True everywhere. (Data available here: doi.org/10.6084/m9.f...) #DataViz #DataVisualization #30DayChartChallenge #TheStateOfOpenData @springernature.com @figshare.com
- Land covee maps go beyond static visuals. In fact, they immerse viewers in the data, making insights clearer and more impactful. Which type of map will you create first? Let’s discuss below! 👇🏻 #GIS #3DMapping #DataVisualization #Rayshader #MappingTutorials #OpenData bsky.app/profile/milo...
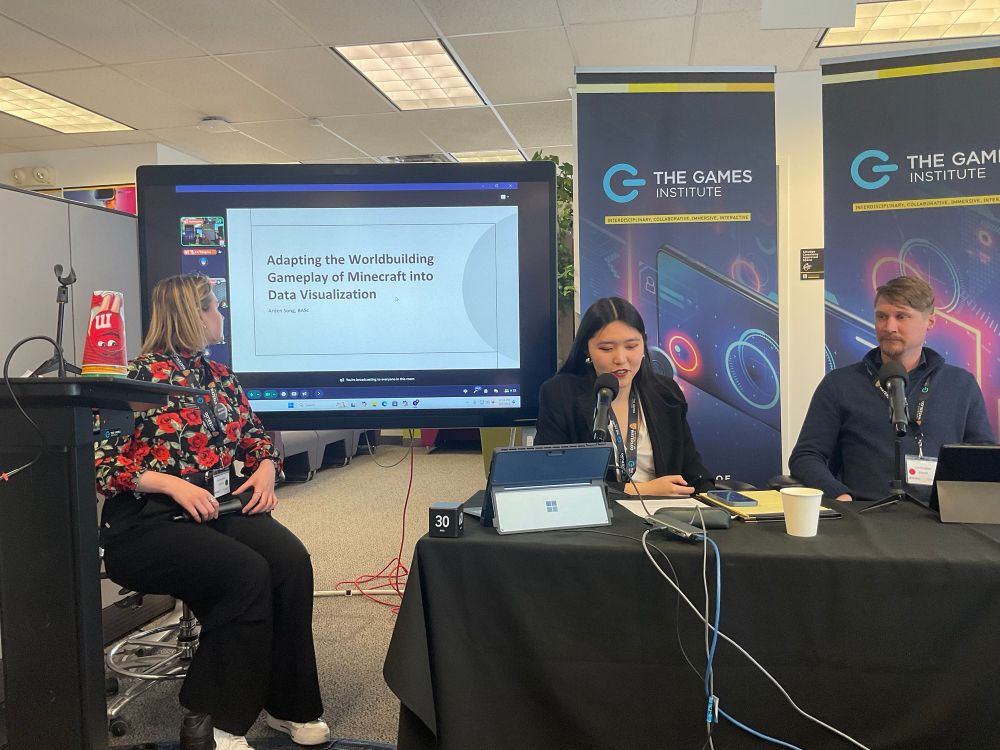
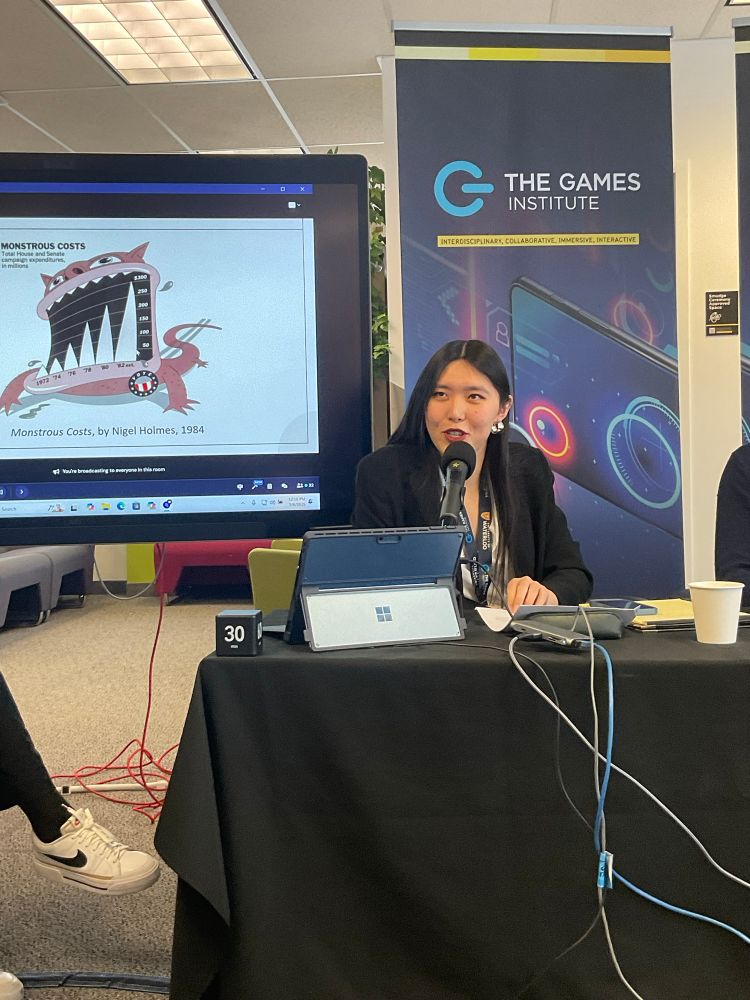
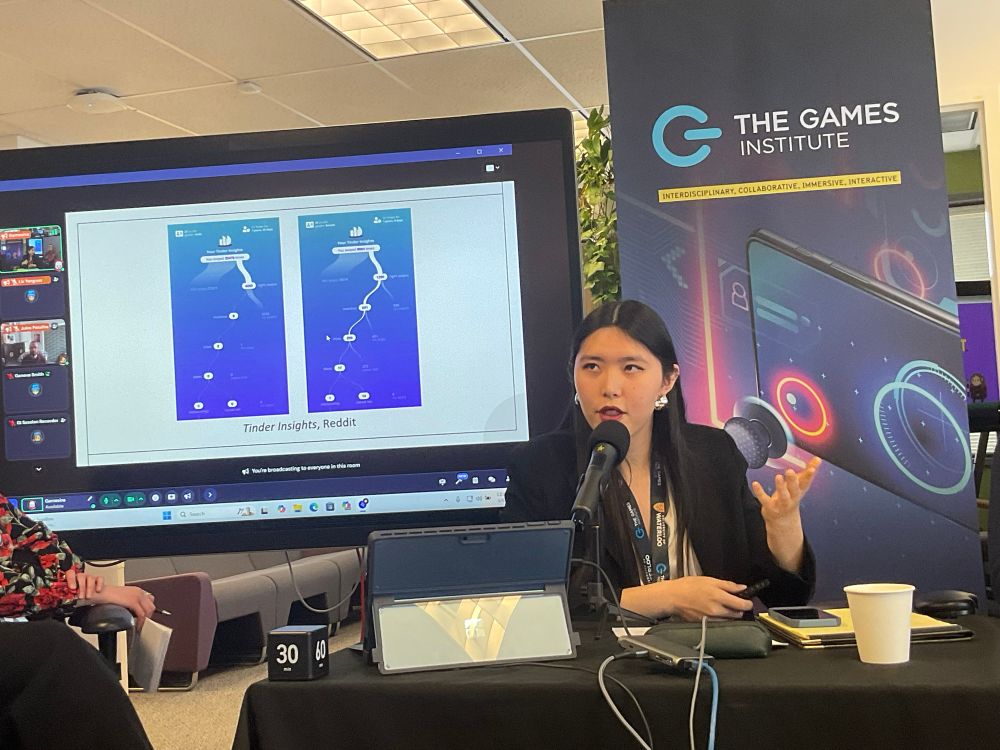
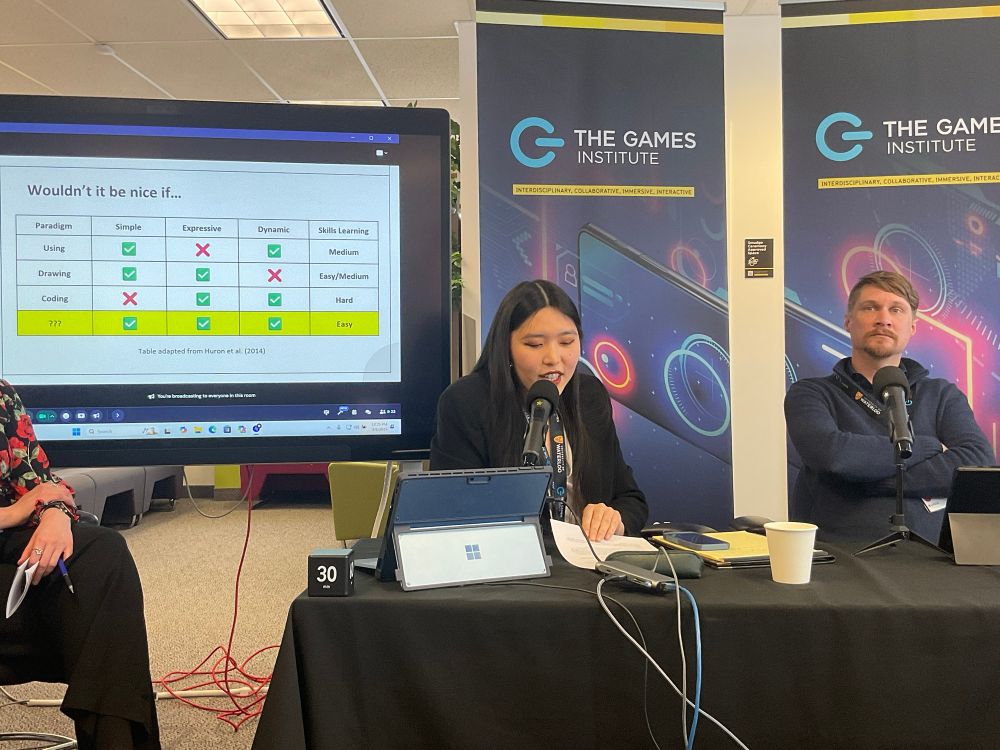
- Here to teach #ICGAN2025 all about data visualization is Arden Song with her presentation “Adapting the Worldbuilding Gameplay of Minecraft into Date Visualizations.” #ICGAN25 #uwaterloo #thegamesinstitute #researchimpact #interdisciplinaryresearch #datavisualization #minecraft
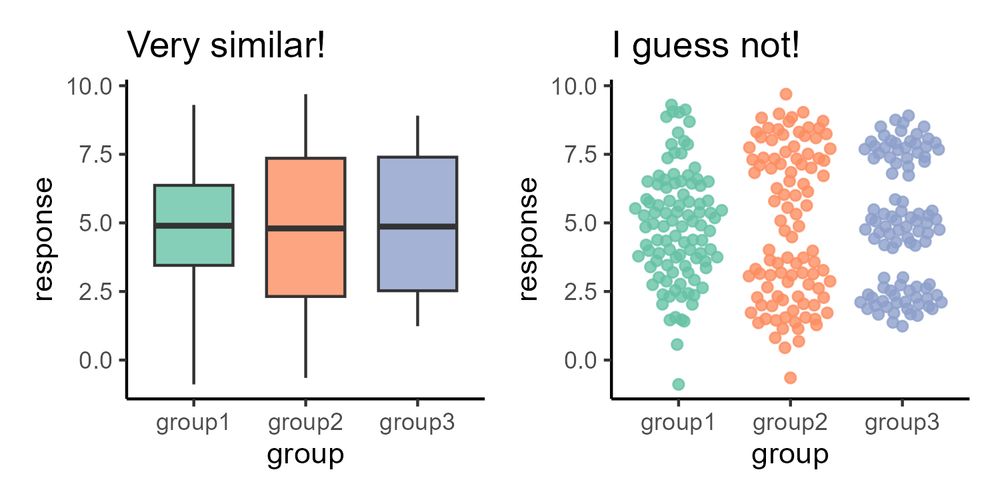
- Friends don't let friends make bad graphs repo has been updated! Friends don't let friends use boxplot for binomial (bimodal) data. Is your box plot hiding something from you? #DataVisualization github.com/cxli233/Frie...