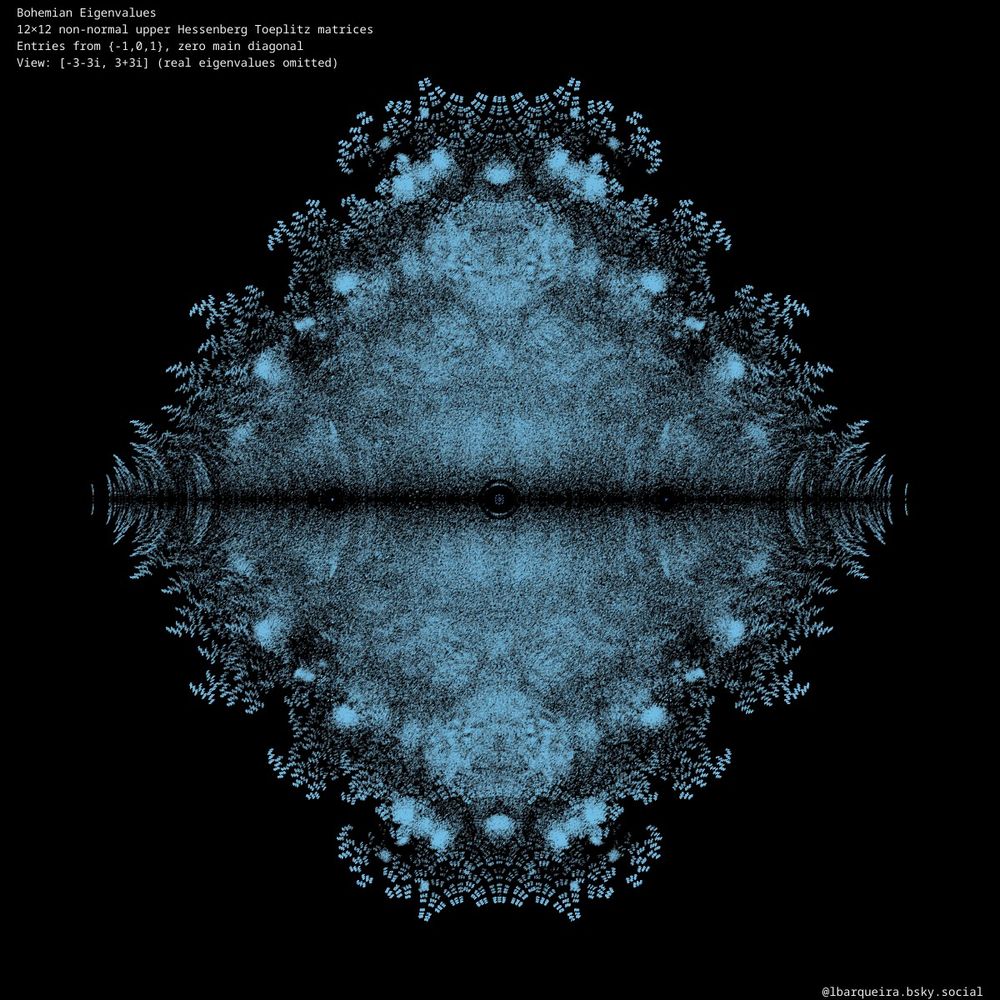
Density plot of Bohemian eigenvalues from 173.800 random 12×12 non-normal upper Hessenberg Toeplitz matrices with entries in {-1,0,1} and zero main diagonal.
Colors represent eigenvalue frequency; real eigenvalues are excluded. Viewed on [-3-3i, 3+3i].
#MathArt#CreativeCoding#Mathematics#SciArt